Determine whether the distribution is a discrete probability distribution. X 100 200 300 400 500 P(x) 0.36 0.22 0.1 0.12 0.21 Is the distribution a discrete probability distribution? OA. No, because the sum of the probabilities is not equal to 1. OB. Yes, because the sum of the probabilities is equal to 1 and each probability is between 0 and 1, im O C. No, because each probability is not between 0 and 1, inclusive. OD. Yes, because the sum of the probabilities is equal to 1.
Determine whether the distribution is a discrete probability distribution. X 100 200 300 400 500 P(x) 0.36 0.22 0.1 0.12 0.21 Is the distribution a discrete probability distribution? OA. No, because the sum of the probabilities is not equal to 1. OB. Yes, because the sum of the probabilities is equal to 1 and each probability is between 0 and 1, im O C. No, because each probability is not between 0 and 1, inclusive. OD. Yes, because the sum of the probabilities is equal to 1.

MATLAB: An Introduction with Applications
6th Edition
ISBN:9781119256830
Author:Amos Gilat
Publisher:Amos Gilat
Chapter1: Starting With Matlab
Section: Chapter Questions
Problem 1P

Related questions
Question

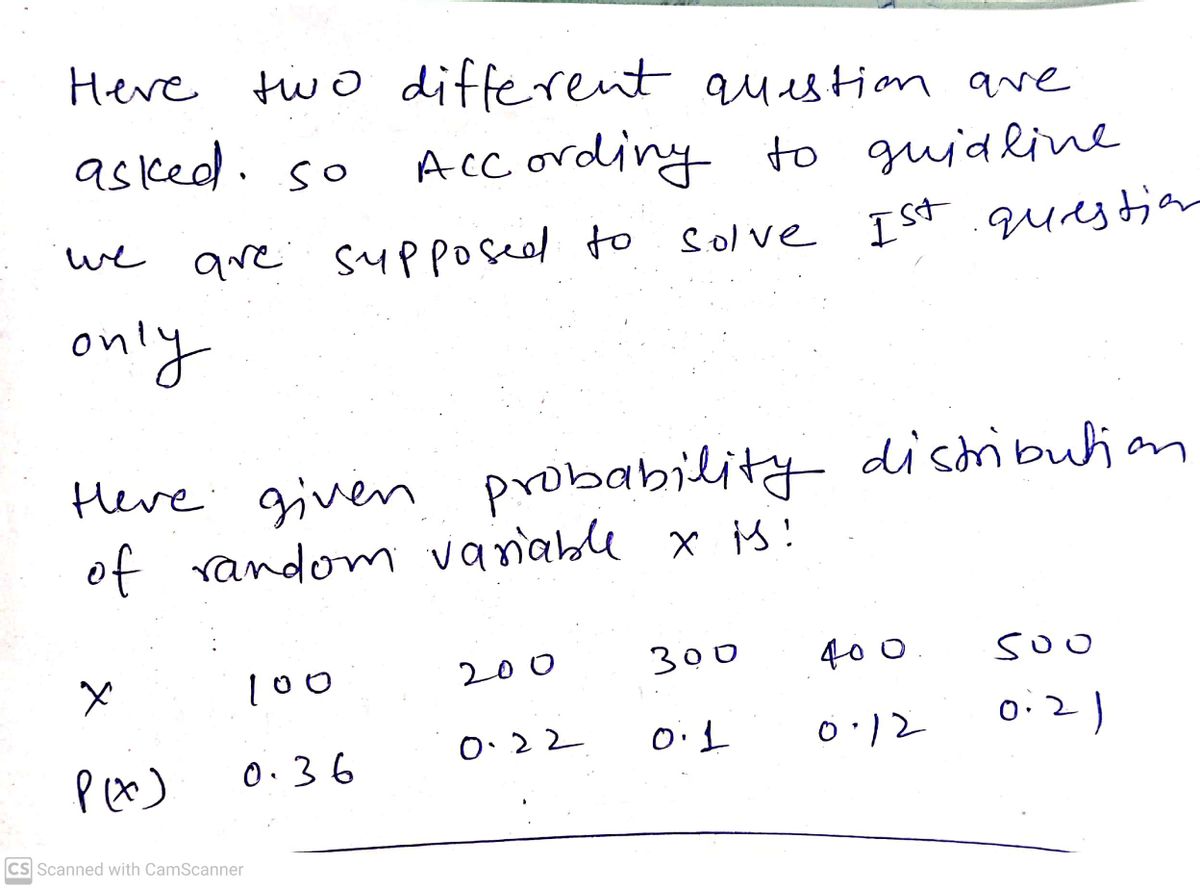
Transcribed Image Text:**Discrete Probability Distribution Analysis**
The image provides a table that outlines a probability distribution for a discrete random variable \( x \). The values and their corresponding probabilities are as follows:
- \( x = 100 \), \( P(x) = 0.36 \)
- \( x = 200 \), \( P(x) = 0.22 \)
- \( x = 300 \), \( P(x) = 0.10 \)
- \( x = 400 \), \( P(x) = 0.12 \)
- \( x = 500 \), \( P(x) = 0.21 \)
**Question:**
Is the distribution a discrete probability distribution?
**Options:**
- **A.** No, because the sum of the probabilities is not equal to 1.
- **B.** Yes, because the sum of the probabilities is equal to 1 and each probability is between 0 and 1, inclusive.
- **C.** No, because each probability is not between 0 and 1, inclusive.
- **D.** Yes, because the sum of the probabilities is equal to 1.
**Explanation:**
For the given distribution to be a discrete probability distribution, the sum of probabilities should equal 1 and each probability value should be between 0 and 1 inclusively.
![Suppose that a recent poll found that 62% of adults believe that the overall state of moral values is poor. Complete parts (a) through (c).
(a) For 450 randomly selected adults, compute the mean and standard deviation of the random variable X, the number of adults who believe that the overall state of moral values is poor.
The mean of X is [ ]. (Round to the nearest whole number as needed.)
The standard deviation of X is [ ]. (Round to the nearest tenth as needed.)
(b) Interpret the mean. Choose the correct answer below:
- A. For every 279 adults, the mean is the maximum number of them that would be expected to believe that the overall state of moral values is poor.
- B. For every 450 adults, the mean is the number of them that would be expected to believe that the overall state of moral values is poor.
- C. For every 450 adults, the mean is the minimum number of them that would be expected to believe that the overall state of moral values is poor.
- D. For every 450 adults, the mean is the range that would be expected to believe that the overall state of moral values is poor.
(c) Would it be unusual if 268 of the 450 adults surveyed believe that the overall state of moral values is poor?
- Yes
- No](/v2/_next/image?url=https%3A%2F%2Fcontent.bartleby.com%2Fqna-images%2Fquestion%2Faba41a1d-d1f3-4790-876b-aeeed0dbb2e9%2F25dd3559-5556-4064-a7a6-81508ef325a1%2Fm60hrtb_processed.jpeg&w=3840&q=75)
Transcribed Image Text:Suppose that a recent poll found that 62% of adults believe that the overall state of moral values is poor. Complete parts (a) through (c).
(a) For 450 randomly selected adults, compute the mean and standard deviation of the random variable X, the number of adults who believe that the overall state of moral values is poor.
The mean of X is [ ]. (Round to the nearest whole number as needed.)
The standard deviation of X is [ ]. (Round to the nearest tenth as needed.)
(b) Interpret the mean. Choose the correct answer below:
- A. For every 279 adults, the mean is the maximum number of them that would be expected to believe that the overall state of moral values is poor.
- B. For every 450 adults, the mean is the number of them that would be expected to believe that the overall state of moral values is poor.
- C. For every 450 adults, the mean is the minimum number of them that would be expected to believe that the overall state of moral values is poor.
- D. For every 450 adults, the mean is the range that would be expected to believe that the overall state of moral values is poor.
(c) Would it be unusual if 268 of the 450 adults surveyed believe that the overall state of moral values is poor?
- Yes
- No
Expert Solution
Step 1

Step by step
Solved in 2 steps with 2 images

Recommended textbooks for you
MATLAB: An Introduction with Applications
Statistics
ISBN:
9781119256830
Author:
Amos Gilat
Publisher:
John Wiley & Sons Inc

Probability and Statistics for Engineering and th…
Statistics
ISBN:
9781305251809
Author:
Jay L. Devore
Publisher:
Cengage Learning

Statistics for The Behavioral Sciences (MindTap C…
Statistics
ISBN:
9781305504912
Author:
Frederick J Gravetter, Larry B. Wallnau
Publisher:
Cengage Learning
MATLAB: An Introduction with Applications
Statistics
ISBN:
9781119256830
Author:
Amos Gilat
Publisher:
John Wiley & Sons Inc
Probability and Statistics for Engineering and th…
Statistics
ISBN:
9781305251809
Author:
Jay L. Devore
Publisher:
Cengage Learning
Statistics for The Behavioral Sciences (MindTap C…
Statistics
ISBN:
9781305504912
Author:
Frederick J Gravetter, Larry B. Wallnau
Publisher:
Cengage Learning

Elementary Statistics: Picturing the World (7th E…
Statistics
ISBN:
9780134683416
Author:
Ron Larson, Betsy Farber
Publisher:
PEARSON

The Basic Practice of Statistics
Statistics
ISBN:
9781319042578
Author:
David S. Moore, William I. Notz, Michael A. Fligner
Publisher:
W. H. Freeman

Introduction to the Practice of Statistics
Statistics
ISBN:
9781319013387
Author:
David S. Moore, George P. McCabe, Bruce A. Craig
Publisher:
W. H. Freeman