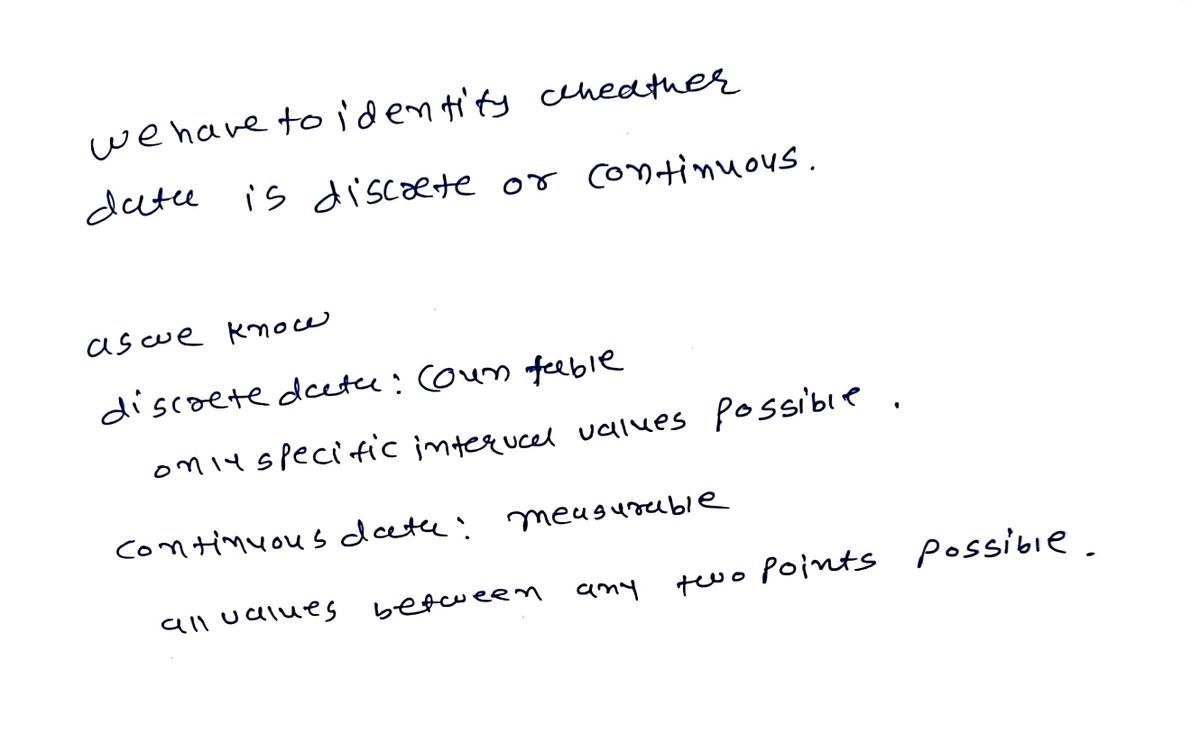
Determine whether the data described are discrete or continuous. The velocity of a pitched baseball. Discrete O Continuous
Q: What information does a residual plot give us?
A: A residual plot is the graph with residuals on vertical axis and independent variable on horizontal…
Q: Characterize the following variables and classify them as qualitative or quantitative. If…
A: “Since you have posted a question with multiple sub-parts, we will solve first three subparts for…
Q: The top schools HCC students transfer to are below from highest to lowest. This type of data is…
A: We have given the following statement
Q: These are the values in Irwin's data set. (1,43),(3,36),(5,22),(6,25),(8,14) Irwin determined the…
A: The actual data is where is the actual value of and the predicted value is where is the…
Q: 5. Identify a type: ordinal, nominal, discrete or continuous? c. Age On = 1, Off= 0 а. b. political…
A: Given some variables, we have to identify the type of variables as nominal, ordinal, discrete or…
Q: A driver records in the table her speed at various times during her journey. Time (min.) Speed (mph)…
A: Given that The scatter plot is created as Excel : data : insert : scatterplot The correct plot is…
Q: Ocean currents are important in studies of climate change, as well as ecology studies of dispersal…
A: x y x2 y2 xy 76 14.2 5776 201.64 1079.2 79 19.6 6241 384.16…
Q: Does the length of a surgery patient's stay in the hospital depend on the length of time the…
A: Given that: Operative time(x) Length of hospital stay (y) 9 13 6 8 8 15 5 7 10 29 1…
Q: Here is a data set to use for the problems below: 52.7, 14.2, 47.7, 52.7, 35.2, 35.6, 33.6, 27,…
A: The data are X: 52.7, 14.2, 47.7, 52.7, 35.2, 35.6, 33.6, 27, 52.7, 24.3
Q: Create a histogram of the actors' age data using Excel First we need to define the bins that Excel…
A: The given data is as follows: Age4340484856386032404237763955453561335132435542373831456046403647The…
Q: Justify whether each set of data as either discrete, continuous or categorical The number of blue…
A:
Q: Person 1 2 Before: 132 135 After: 118 137 3 149 4 133 139 5 6 7 8 9 10 119 121 130 132 119 110 105…
A: QQ plot is also known as Quantile Quantile plot. It is a type of scatter plot and compares the two…
Q: 3. Determine whether the data described are qualitative or quantitative The rate at which your heart…
A: Solution-: (3) The data describe are qualitative or quantitative The rate at which your heart…
Q: The scatter plot shows the sizes and annual rents of some office spaces in the downtown area of a…
A: The scatterplot for the sizes and annual rents of some office spaces in the downtown area of a city…
Q: ans 1. Plot the data in a scatter plot. 25 25 150 75 225 100 150 14 6. 20 12 16 14 20 15 10 5 50 100…
A: To plot the following scatter plot x 25 150 75 225 100 150 y 14 6 20 12 16 14
Q: This is a type of diagram where pairs of x and y data are plotted in x and y axes.
A: We have to determine the diagram to plot the pairs of x and y.
Q: Identify whether the following variables are qualitative or quantitative. If it is quantitative,…
A: In question, Given that The freshmen college students came from either public or private schools.…
Q: n currents are important in studies of climate change, as well as ecology studies of dispersal of…
A:
Q: Grass buffer strips are grassy areas that are planted between bodies of water and agricultural…
A: Hi! Thank you for the question As per the honour code, We’ll answer the first question since the…
Q: Identify the type of data that would be used to describe a response. Length of a spaceship. O…
A: Length of a spaceship is quantitative continuous variable
Q: Consider the following data: 1 1.6 2.9 3. 4.1 4.4 5.8 6.5 7.1 7.2 7.5 y 3. 3.3 4 4.1 4.8 5.4 5.6 5.9…
A: Hi! Thank you for the question, As per the honor code, we are allowed to answer three sub-parts at a…
Q: Weekly sales of bread at a local Foods Market are given in the table below. Forecast sales for week…
A: Given the weekly sales of bread at a local Foods Market asWeekSales14022385342043825410643273858411
Q: Find the equation of the least-squares line. (Round your values to four decimal places.) Use the…
A: Given data, X Y X*Y X*X 2 91 182 4 6 46 276 36 7 32 224 49 9 6 54 81 12 4 48 144
Q: answer letter c using least square method
A: Least square equation estimate the regression line which in turn used to predict the future variable…
Q: Which of the following is NOT one of IBM's big data characteristics? Variety Velocity Venn diagram…
A: Big data is the data set, which have huge volume that is beyond to perform manual analysis. Such…
Q: Classify the data a continuous or discrete. The number of e mails received in a given day.
A: since we know that discrete data: Discrete data is a data thatcan be counted while on the other…
Q: Determine whether the following examples are discrete or continuous data sets. Write "DISCRETE" for…
A:
Q: Ocean currents are important in studies of climate change, as well as ecology studies of dispersal…
A: (a) Obtain the values of given sums. The values of given sums is obtained below as follows:…
Q: Define the term statistics. Define the term data as it relates to statistics. In the data…
A: Statistics:Statistics is a branch of mathematics that deals with the collection, analysis,…
Q: Ocean currents are important in studies of climate change, as well as ecology studies of dispersal…
A: Comment: As per the our company guidelines we are supposed to answer only three subparts. Kindly…
Q: QUESTION 5 Categorical data use either the scale of measurement. or O a. nominal; ordinal O b.…
A:
Q: Five number summery consist of minimum number first quartile , median , third quartile, maximum…
A: Given : Minimum =28 Q1 = 68 Median = 118 Q3 = 260 Maximum = 577
Q: There is a significant relationship between the data sets at the 55% significance level. There is Ya…
A: The value of correlation coefficient is given by r = 0.986
Q: not use ai please
A: Approach to solving the question: The type of data represented by categories or names is B)…
Q: This question utilizes the BookPrices data set found in the resampledata package. This data set…
A: The data to be used in R is BookPricesThe sample data obtained from R is as followsIt is required to…
Q: Please use inequalities to define the data collection of the following solid shape.
A:
Q: I need help with this please
A: Step 1: Understanding the Model EquationThe equation y_i = β₀ + β₁x₁i + β₂x₂i + β₁₂x₁ix₂i + e_i…
Q: The variables "Purchase Made," "Purchase NOT Made," Sunny", Cloudy," and "Rainy" are best…
A: Given that -
Q: Help please: Alice throws darts at a circular target of radius r and is equally likely to hit any…
A: Here given that Alice throws darts at a circular target of radius r and is equally likely to hit any…
Q: Risky Drivers The following table gives the policereported crashes per million miles traveled for…
A: Create a scatter plot using online tool or ms excel. Then use linear regression to find the exact…
Q: Data Frequency 40 - 44 45- 49 4. 50 54 55 59 12 60 64 16 65 69 11 70-74 75 - 79 1 80 84 mode median…
A:
Trending now
This is a popular solution!
Step by step
Solved in 2 steps with 2 images
- You wonder whether talking to plants keeps them from dying. You conduct a study in which you talk to one group of five plants and do not talk to a second group of five plants. After two weeks, you record whether each plant has lived or died. This assessment of plant health is a(n) _____ dependent variable, which means that the data can be analyzed using a(n) _____ test. a. nominal; parametric b. interval; parametric c. interval; nonparametric d. nominal; nonparametricOcean currents are important in studies of climate change, as well as ecology studies of dispersal of plankton. Drift bottles are used to study ocean currents in the Pacific near Hawaii, the Solomon Islands, New Guinea, and other islands. Let x represent the number of days to recovery of a drift bottle after release and y represent the distance from point of release to point of recovery in km/100. The following data are representative of one study using drift bottles to study ocean currents. 203 x days y km/100 72 76 32 14.7 94 11.7 19.5 5.3 35.6 (a) Verify that Ex = 477, Ey = 86.8, Ex? = 62,029, Ey2 = 2028.68, Exy = 11036.6, and r= 0.93853. Ex Ey Ex? Ey2| Exy (b) Use a 1% level of significance to test the claim p> 0. (Use 2 decimal places.) critical t Conclusion Reject the null hypothesis, there is sufficient evidence that p > 0. Reject the null hypothesis, there is insufficient evidence that p > 0. O Fail to reject the null hypothesis, there is insufficient evidence that p > 0. O…Ocean currents are important in studies of climate change, as well as ecology studies of dispersal of plankton. Drift bottles are used to study ocean currents in the Pacific near Hawaii, the Solomon Islands, New Guinea, and other islands. Let x represent the number of days to recovery of a drift bottle after release and y represent the distance from point of release to point of recovery in km/100. The following data are representative of one study using drift bottles to study ocean currents. x days y km/100 71 76 31 92 203 14.2 19.6 5.8 11.2 35.9 (a) Verify that Ex = 473, Ey = 86.7, Ex = 61,451, Ey = 2033.69, Exy = 10995.7, and r 0.93868. %3D %3D %3D %3D Σχ 1 473 ΣΥ| 86.7 Ex2 61451 Ey2 2033.69 Exy 10995.7 r0.93868 (b) Use a 1% level of significance to test the claim p > 0. (Use 2 decimal places.) t 4.72 critical t 4.54 Conclusion Reject the null hypothesis, there is sufficient evidence that p > 0. O Reject the null hypothesis, there is insufficient evidence that p > 0. Fail to reject…
- please answer question 2Ocean currents are important in studies of climate change, as well as ecology studies of dispersal of plankton. Drift bottles are used to study ocean currents in the Pacific near Hawaii, the Solomon Islands, New Guinea, and other islands. Let x represent the number of days to recovery of a drift bottle after release and y represent The distance from point of release to point of recovery in km/100. The following data a representative of one study using drift bottles to study ocean currents. x day 72 79 32 96 203 y km/100 14.8 19.6 5.3 11.8 35.1 Σx=482 Σy=86.6 Σx2=62874 Σy2=2002.54 Σxy=11041.7 r=.93787 use a 1% level of significance to test the claim p>0.(use 2 decimal places) t=critical t= Se=4.4913 a=1.4966 b=.1641 D) find the predicted distance (km/100) when a drift bottle has been floating for 80 days.(use 2 decimal places) find a 90% confidence interval for your prediction of part D. (use 2 decimal places) lower limit=___km/100upper limit=___km/100 he was a 1% level of…Brand A vitamins 505 506 502 S04 503 S01 S00 497 198 amount of Vitamin C in each pill was measured and plotted. From this dot plot, find the median, quartiles, and interquartile range: 494 196 495 40 samples of Vitamin C pills were 493 492 Milligrams of vitamin C taken from bottles of Brand A and the Quartile 1: Median: Quartile 3: Interquartile Range: 507 0odso 00od 000od 00od
- File Edit View History Home - myRCC Frequency mylearning.suny.edu/d21/le/content/920969/viewContent/25846458/View -10 8 n= Data was collected for a sample of organic snacks. The amount of sugar (in mg) in each snack is summarized in the histogram below. 6 X 2 Bookmarks Profiles Tab Window Help A.1 HW-23FA STATISTICS (81 X 160 164 168 172 176 180 184 188 amount of sugar (mg) Q What is the sample size for this data set? Submit Question Question Help: Video b Enter your payment details | ba x + BUN SEP 15 MacBook AirWhich of the following must be entries from the original data set? the mode the range the third quartile the median the maximumThe table provided below shows paired data for the heights of a certain country's presidents and their main opponents in the election campaign. Construct a scatterplot. Does there appear to be a correlation? Click the icon to view the data table for election heights. Construct a scatterplot. Choose the correct graph below. OA. В. C. D. 200- 200- 200- 200- 160+ 160 President's height 160+ 160 President's height 160+ 160 President's height 160- 160 President's height 200 200 200 200 Does there appear to be a correlation between the president's height and his opponent's height? A. Yes, there appears to be a correlation. As the president's height increases, his opponent's height increases. B. Yes, there appears to be a correlation. The candidate with the highest height usually wins. C. Yes, there appears to be a correlation. As the president's height increases, his opponent's height decreases. D. No, there does not appear to be a correlation because there is no general pattern to the data.…
- .The two data sets below represent the high temperatures in two citieseach day for 5 days.City A: 18°F, 44°F, 52°F, 55°F, 58°F, 56°FCity B: 15°F, 41°F, 63°F, 61°F, 57°F, 60°F Which statementbestdescribes the measure of center that provides themost accurate estimation of the high temperature in a day in each city? A.mean, because there is an even number of values in each data set B.median, because there is an even number of values in each data set C.mean, because there is one value in each data set that is significantlylower than the other values D.median, because there is one value in each data set that issignificantly lower than the other valuesI need help with this pleaseI need help with this please