Data show that men between the ages of 20 and 29 in a general population have a mean height of 69.3 inches, with a standard deviation of 2.5 inches. A baseball analyst wonders whether the standard deviation of heights of major-league baseball players is less than 2.5 inches. The heights (in inches) of 20 randomly selected players are shown in the table. EA Click the icon to view the data table. Test the notion at the a 0.01 level of significance. O Data Table What are the correct hypotheses for this test? - 2.5. The null hypothesis is Ho: o The alternative hypothesis is H,: o < 2.5. 72 74 71 73 76 70 77 75 72 72 77 72 75 70 73 74 75 73 74 73 Calculate the value of the test statistic. x- 12.608 (Round to three decimal places as needed.) Use technology to determine the P-value for the test statistic. Print Done The P-value is (Round to three decimal places as needed.)
Inverse Normal Distribution
The method used for finding the corresponding z-critical value in a normal distribution using the known probability is said to be an inverse normal distribution. The inverse normal distribution is a continuous probability distribution with a family of two parameters.
Mean, Median, Mode
It is a descriptive summary of a data set. It can be defined by using some of the measures. The central tendencies do not provide information regarding individual data from the dataset. However, they give a summary of the data set. The central tendency or measure of central tendency is a central or typical value for a probability distribution.
Z-Scores
A z-score is a unit of measurement used in statistics to describe the position of a raw score in terms of its distance from the mean, measured with reference to standard deviation from the mean. Z-scores are useful in statistics because they allow comparison between two scores that belong to different normal distributions.
![Data show that men between the ages of 20 and 29 in a general population have a mean height of 69.3 inches, with a standard deviation of 2.5 inches. A baseball analyst wonders whether the standard deviation of heights of major-league
baseball players is less than 2.5 inches. The heights (in inches) of 20 randomly selected players are shown in the table.
E Click the icon to view the data table.
Test the notion at the a= 0.01 level of significance.
Data Table
What are the correct hypotheses for this test?
The null hypothesis is Ho: o
= 2.5
The alternative hypothesis is H,: 6
< 2.5.
72 74 71 73 76
70 77 75 72 72
77 72 75 7O 73
74 75 73 74 73
Calculate the value of the test statistic.
x= 12.608 (Round to three decimal places as needed.)
Use technology to determine the P-value for the test statistic
Print
Done
The P-value is
(Round to three decimal places as needed.)
Enter your answer in the answer box and then click Check Answer,
Check Answer
1 part
remaining
Clear All
MacBook Pro
F7
F8
F10
F2
esc
F4
F5
F6
F1
#3
24
%
&
6
9
3
Y
Q
tab
F
K
caps lock](/v2/_next/image?url=https%3A%2F%2Fcontent.bartleby.com%2Fqna-images%2Fquestion%2F9efa3a01-e7c8-4d26-b592-6c4abb6a8b85%2F2c5ce8fd-038c-492a-9035-5eebc76e0be3%2Fcyw46o_processed.jpeg&w=3840&q=75)
![](/static/compass_v2/shared-icons/check-mark.png)
Step-by-step procedure to obtain the variance using Excel is given below:
- In Excel sheet, enter Data in one column.
- In Data, select Data Analysis and choose Descriptive statistics.
- In Input Variable Range, select Data.
- Select Summary Statistics.
- Click Labels.
- Click Ok.
Output obtained using the Excel is given below:
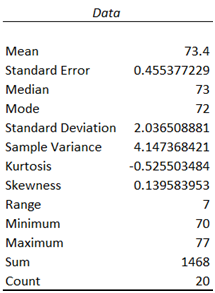
From the output, the standard deviation is 2.036.
The test hypotheses are given below:
Null hypothesis:
H0: σ=2.5
Alternative hypothesis:
H0: σ<2.5
Trending now
This is a popular solution!
Step by step
Solved in 2 steps with 2 images
![Blurred answer](/static/compass_v2/solution-images/blurred-answer.jpg)
![MATLAB: An Introduction with Applications](https://www.bartleby.com/isbn_cover_images/9781119256830/9781119256830_smallCoverImage.gif)
![Probability and Statistics for Engineering and th…](https://www.bartleby.com/isbn_cover_images/9781305251809/9781305251809_smallCoverImage.gif)
![Statistics for The Behavioral Sciences (MindTap C…](https://www.bartleby.com/isbn_cover_images/9781305504912/9781305504912_smallCoverImage.gif)
![Elementary Statistics: Picturing the World (7th E…](https://www.bartleby.com/isbn_cover_images/9780134683416/9780134683416_smallCoverImage.gif)
![The Basic Practice of Statistics](https://www.bartleby.com/isbn_cover_images/9781319042578/9781319042578_smallCoverImage.gif)
![Introduction to the Practice of Statistics](https://www.bartleby.com/isbn_cover_images/9781319013387/9781319013387_smallCoverImage.gif)