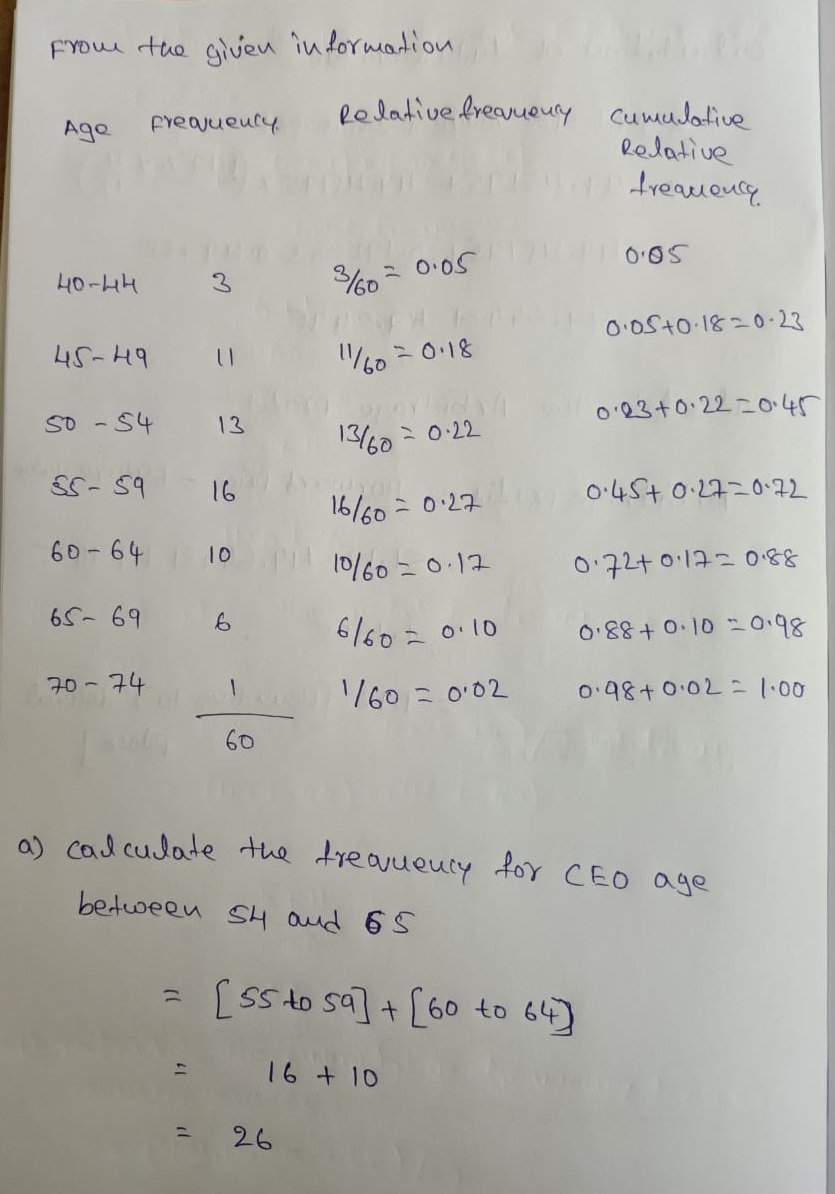
Could you please tell me if my work is correct? Forbes magazine published data on the best small firms in 2012. These were firms which had been publicly listed for at least a year, have a stock price of at least $5 per share, and have reported annual revenue between $5 million and $1 billion. The table shows the ages of the chief executive officers for the first 60 ranked firms.
Could you please tell me if my work is correct?
Forbes magazine published data on the best small firms in 2012. These were firms which had been publicly listed for at least a year, have a stock price of at least $5 per share, and have reported annual revenue between $5 million and $1 billion. The table shows the ages of the chief executive officers for the first 60 ranked firms.
|
Age |
Frequency |
Relative Frequency |
Cumulative Relative Frequency |
|
40–44 |
3 |
0.05 |
0.05 |
|
45–49 |
11 |
0.18 |
0.23 |
|
50–54 |
13 |
0.22 |
0.45 |
|
55–59 |
16 |
0.27 |
0.72 |
|
60–64 |
10 |
0.17 |
0.88 |
|
65–69 |
6 |
0.10 |
0.98 |
|
70–74 |
1 |
0.02 |
1.00 |
|
Total: |
60 |
1 |
|
How I got the calculations:
|
Age |
Frequency |
Relative Frequency |
Cumulative Relative Frequency |
|
40–44 |
3 |
=F10/F17 |
=G10 |
|
45–49 |
11 |
=F11/F17 |
=H10+G11 |
|
50–54 |
13 |
=F12/F17 |
=H11+G12 |
|
55–59 |
16 |
=F13/F17 |
=H12+G13 |
|
60–64 |
10 |
=F14/F17 |
=H13+G14 |
|
65–69 |
6 |
=F15/F17 |
=H14+G15 |
|
70–74 |
1 |
=F16/F17 |
=H15+G16 |
|
Total: |
=SUM(F10:F16) |
=SUM(G10:G16) |
|
- What is the frequency for CEO ages between 54 and 65?
45
Work:
13+16+10+6 = 45
- What percentage of CEOs are 65 years or older?
It is 12%
7/60 = .12 * 100 = 12%
- What is the relative frequency of ages under 50?
.23
Work
.05+.18 = .23
- What is the cumulative relative frequency for CEOs younger than 55?
.45

Trending now
This is a popular solution!
Step by step
Solved in 2 steps with 2 images


