Construct the indicated confidence interval for the population mean u using the t-distribution. Assume the population is normally distributed. c = 0.95, x= 12.6, s=3.0, n= 10 (1) (Round to one decimal place as needed.)
Construct the indicated confidence interval for the population mean u using the t-distribution. Assume the population is normally distributed. c = 0.95, x= 12.6, s=3.0, n= 10 (1) (Round to one decimal place as needed.)

MATLAB: An Introduction with Applications
6th Edition
ISBN:9781119256830
Author:Amos Gilat
Publisher:Amos Gilat
Chapter1: Starting With Matlab
Section: Chapter Questions
Problem 1P

Related questions
Topic Video
Question
100%
![**Confidence Interval Construction Using the t-Distribution**
**Problem Statement:**
Construct the indicated confidence interval for the population mean (μ) using the t-distribution. Assume the population is normally distributed.
- Confidence level (c) = 0.95
- Sample mean (\( \bar{x} \)) = 12.6
- Sample standard deviation (s) = 3.0
- Sample size (n) = 10
**Confidence Interval:**
\[ (\_, \_) \]
**Instructions:**
Round to one decimal place as needed.
**Understanding Confidence Intervals:**
A confidence interval provides a range of values that is likely to contain the population mean (μ) with a certain level of confidence. When the population standard deviation is unknown and the sample size is small (typically n < 30), the t-distribution is more appropriate than the normal distribution for constructing the interval. Here, we use a 95% confidence level, which means we are 95% confident that the interval calculated from the sample data contains the true population mean.
To calculate the confidence interval, you would generally follow these steps:
1. Determine the t-score for your confidence level and degrees of freedom (df = n - 1).
2. Calculate the standard error (SE) of the mean: SE = s / √n.
3. Calculate the margin of error (ME): ME = t-score * SE.
4. Determine the confidence interval: ( \( \bar{x} \) - ME, \( \bar{x} \) + ME ).
**Note:** Provide actual values in place of placeholders after computation.](/v2/_next/image?url=https%3A%2F%2Fcontent.bartleby.com%2Fqna-images%2Fquestion%2F09fc76f0-690c-4548-a807-d9841947f510%2Fa4be107c-f5ea-49a9-900d-0832e96a0595%2Fv8ummil_processed.png&w=3840&q=75)
Transcribed Image Text:**Confidence Interval Construction Using the t-Distribution**
**Problem Statement:**
Construct the indicated confidence interval for the population mean (μ) using the t-distribution. Assume the population is normally distributed.
- Confidence level (c) = 0.95
- Sample mean (\( \bar{x} \)) = 12.6
- Sample standard deviation (s) = 3.0
- Sample size (n) = 10
**Confidence Interval:**
\[ (\_, \_) \]
**Instructions:**
Round to one decimal place as needed.
**Understanding Confidence Intervals:**
A confidence interval provides a range of values that is likely to contain the population mean (μ) with a certain level of confidence. When the population standard deviation is unknown and the sample size is small (typically n < 30), the t-distribution is more appropriate than the normal distribution for constructing the interval. Here, we use a 95% confidence level, which means we are 95% confident that the interval calculated from the sample data contains the true population mean.
To calculate the confidence interval, you would generally follow these steps:
1. Determine the t-score for your confidence level and degrees of freedom (df = n - 1).
2. Calculate the standard error (SE) of the mean: SE = s / √n.
3. Calculate the margin of error (ME): ME = t-score * SE.
4. Determine the confidence interval: ( \( \bar{x} \) - ME, \( \bar{x} \) + ME ).
**Note:** Provide actual values in place of placeholders after computation.
Expert Solution
Step 1
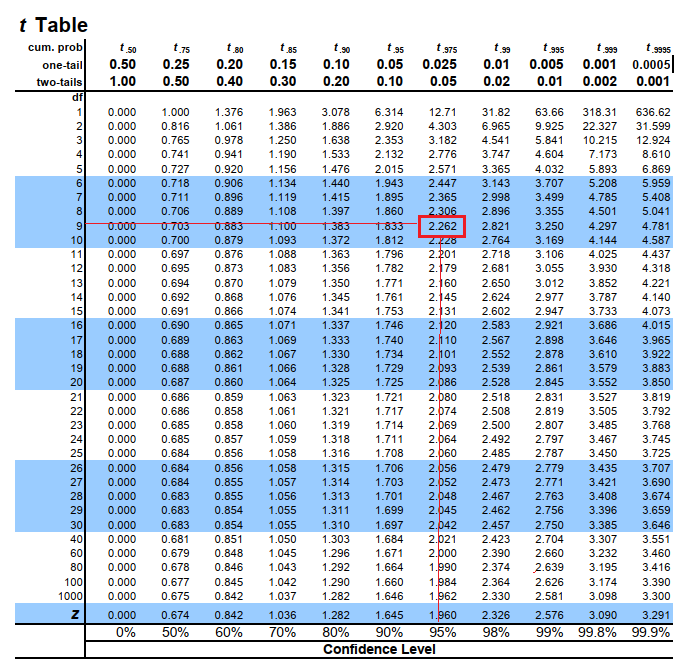
Since population standard deviation is unknown, Use t-distribution to find t-critical value.
Find the t-critical value:
Refer t-distribution table and look for t value corresponding to degrees of freedom=9 & confidence level of 95%.
Therefore,

Step by step
Solved in 2 steps with 15 images

Knowledge Booster


Learn more about
Need a deep-dive on the concept behind this application? Look no further. Learn more about this topic, statistics and related others by exploring similar questions and additional content below.Recommended textbooks for you
MATLAB: An Introduction with Applications
Statistics
ISBN:
9781119256830
Author:
Amos Gilat
Publisher:
John Wiley & Sons Inc

Probability and Statistics for Engineering and th…
Statistics
ISBN:
9781305251809
Author:
Jay L. Devore
Publisher:
Cengage Learning

Statistics for The Behavioral Sciences (MindTap C…
Statistics
ISBN:
9781305504912
Author:
Frederick J Gravetter, Larry B. Wallnau
Publisher:
Cengage Learning
MATLAB: An Introduction with Applications
Statistics
ISBN:
9781119256830
Author:
Amos Gilat
Publisher:
John Wiley & Sons Inc
Probability and Statistics for Engineering and th…
Statistics
ISBN:
9781305251809
Author:
Jay L. Devore
Publisher:
Cengage Learning
Statistics for The Behavioral Sciences (MindTap C…
Statistics
ISBN:
9781305504912
Author:
Frederick J Gravetter, Larry B. Wallnau
Publisher:
Cengage Learning

Elementary Statistics: Picturing the World (7th E…
Statistics
ISBN:
9780134683416
Author:
Ron Larson, Betsy Farber
Publisher:
PEARSON

The Basic Practice of Statistics
Statistics
ISBN:
9781319042578
Author:
David S. Moore, William I. Notz, Michael A. Fligner
Publisher:
W. H. Freeman

Introduction to the Practice of Statistics
Statistics
ISBN:
9781319013387
Author:
David S. Moore, George P. McCabe, Bruce A. Craig
Publisher:
W. H. Freeman