Construct a Confidlomce hiterval pd, fhe nuan of fle diffevemce d for the pepaketiun of pairad data. ASume Hat the pepulaton of paived difoumces lc nonnely walm y paral to uaromidad 57 A fasf of abstact reasonimg Sample of Stuclents be fire comcl affer they Completad 9 turmal hgic Course. The yasuits are gien belar.construct a 95%° Confilemce ntenal fr fhe Mean differermie butneeen the hefove and affer scores Before F4 83 75 8884 63 93 84 91 77 After 73 77 70 7774 67 95 83 84 75 li ven to a random
Construct a Confidlomce hiterval pd, fhe nuan of fle diffevemce d for the pepaketiun of pairad data. ASume Hat the pepulaton of paived difoumces lc nonnely walm y paral to uaromidad 57 A fasf of abstact reasonimg Sample of Stuclents be fire comcl affer they Completad 9 turmal hgic Course. The yasuits are gien belar.construct a 95%° Confilemce ntenal fr fhe Mean differermie butneeen the hefove and affer scores Before F4 83 75 8884 63 93 84 91 77 After 73 77 70 7774 67 95 83 84 75 li ven to a random

MATLAB: An Introduction with Applications
6th Edition
ISBN:9781119256830
Author:Amos Gilat
Publisher:Amos Gilat
Chapter1: Starting With Matlab
Section: Chapter Questions
Problem 1P

Related questions
Question

Transcribed Image Text:Construct a Confidlomce hiterval pd, fhe nuan of fle
diffevemce d for the pepaketiun of pairad data. ASume
Hat the pepulaton of paived difoumces lc nonnely
walm y paral to uaromidad
57 A fasf of abstact reasonimg
Sample of Stuclents be fire comcl affer they Completad 9
turmal hgic Course. The yasuits are gien belar.construct
a 95%° Confilemce ntenal fr fhe Mean differermie
butneeen the hefove and affer scores
Before F4 83 75 8884 63 93 84 91 77
After 73 77 70 7774 67 95 83 84 75
li ven to a random
Expert Solution
Step 1
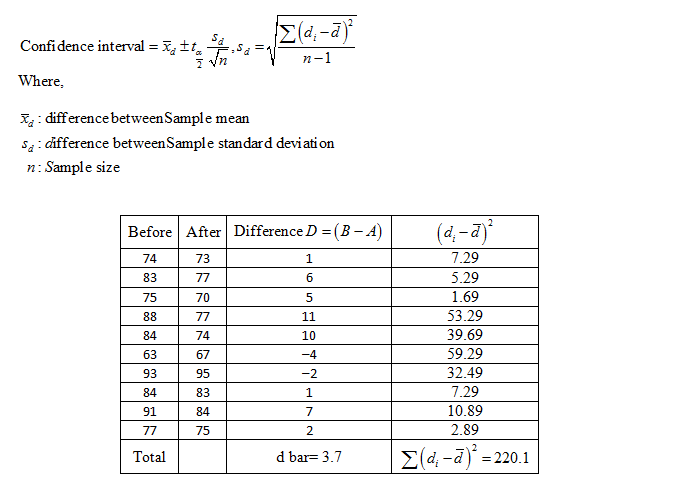
Obtain the 95% confidence interval for the mean difference between the before and after scores.
The 95% confidence interval for the mean difference between the before and after scores is obtained below:
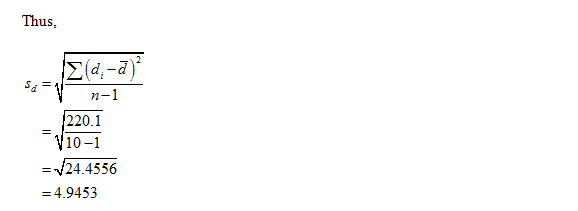
The formula for the Confidence interval for paired differences between the mean is:
Obtain the degrees of degrees of freedom.
The degrees of freedom are obtained below:
From the information, given that there is a sample of 10 participants.
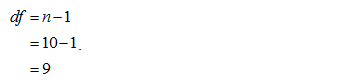
Thus, the degrees of freedom used are 9.

Trending now
This is a popular solution!

Step by step
Solved in 2 steps with 4 images

Recommended textbooks for you
MATLAB: An Introduction with Applications
Statistics
ISBN:
9781119256830
Author:
Amos Gilat
Publisher:
John Wiley & Sons Inc

Probability and Statistics for Engineering and th…
Statistics
ISBN:
9781305251809
Author:
Jay L. Devore
Publisher:
Cengage Learning

Statistics for The Behavioral Sciences (MindTap C…
Statistics
ISBN:
9781305504912
Author:
Frederick J Gravetter, Larry B. Wallnau
Publisher:
Cengage Learning
MATLAB: An Introduction with Applications
Statistics
ISBN:
9781119256830
Author:
Amos Gilat
Publisher:
John Wiley & Sons Inc
Probability and Statistics for Engineering and th…
Statistics
ISBN:
9781305251809
Author:
Jay L. Devore
Publisher:
Cengage Learning
Statistics for The Behavioral Sciences (MindTap C…
Statistics
ISBN:
9781305504912
Author:
Frederick J Gravetter, Larry B. Wallnau
Publisher:
Cengage Learning

Elementary Statistics: Picturing the World (7th E…
Statistics
ISBN:
9780134683416
Author:
Ron Larson, Betsy Farber
Publisher:
PEARSON

The Basic Practice of Statistics
Statistics
ISBN:
9781319042578
Author:
David S. Moore, William I. Notz, Michael A. Fligner
Publisher:
W. H. Freeman

Introduction to the Practice of Statistics
Statistics
ISBN:
9781319013387
Author:
David S. Moore, George P. McCabe, Bruce A. Craig
Publisher:
W. H. Freeman