1-mey a Ed found that the average fer all Students who feel that good manners are naessary to be 75wAh Stardarol devration. of 251 Assume they tuk a random This data is namally distmatcd. Sampie of 64 Studen ts Find the probabıllty that the average numberdE Students that Shere this view Is mee than 78 Students O find the pr bability that the averaje anumberof stucdents that share this view is between 65 and 3
Compound Probability
Compound probability can be defined as the probability of the two events which are independent. It can be defined as the multiplication of the probability of two events that are not dependent.
Tree diagram
Probability theory is a branch of mathematics that deals with the subject of probability. Although there are many different concepts of probability, probability theory expresses the definition mathematically through a series of axioms. Usually, these axioms express probability in terms of a probability space, which assigns a measure with values ranging from 0 to 1 to a set of outcomes known as the sample space. An event is a subset of these outcomes that is described.
Conditional Probability
By definition, the term probability is expressed as a part of mathematics where the chance of an event that may either occur or not is evaluated and expressed in numerical terms. The range of the value within which probability can be expressed is between 0 and 1. The higher the chance of an event occurring, the closer is its value to be 1. If the probability of an event is 1, it means that the event will happen under all considered circumstances. Similarly, if the probability is exactly 0, then no matter the situation, the event will never occur.

a)
The Z-score of a random variable X is defined as follows:
Z = (X – µ)/σ.
Here, µ and σ are the mean and standard deviation of X, respectively.
Consider a random variable X, that defines the number of students, who feel that good manners are necessary.
According to the given information, X have mean µx = 75 and the standard deviation of σ x = 25.
According to central limit theorem, for large sample (>30) or if the population follows normal distribution, then the sampling distribution of the sample mean follows normal distribution with the expectation and standard deviation defined as follows:
E(x̅) = µ and SD(x̅) = σ/√n.
Here, n is the sample size, µ is the population mean and σ is the population standard deviation of the random variable X.
Consider that x̅ is the sample mean.
Now, for sample of 64, the mean of the sampling distribution of the sample mean is,
µx̅ = 75.
Now, for sample of 64, the standard deviation of the sampling distribution of the sample mean is,
σx̅ = 25/√64
= 3.125.
Thus, the sampling distribution of x̅ is approximately normal with mean µx̅ = 75 and standard deviation σx̅ = 3.125.
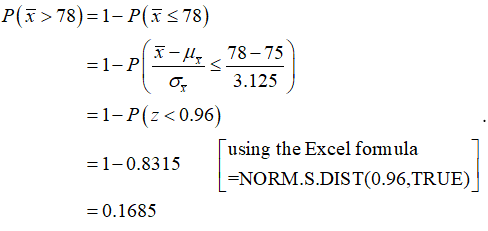
The probability that the average number of students that show this view is more than 78 students is,

Therefore, the probability that the average number of students that show this view is more than 78 students is 0.1685.
Step by step
Solved in 3 steps with 2 images


