Consider the following variables: Y=daily productivity score (measured in points) X1=0 if undergraduate student,1 if graduate student X2=hours of sleep per night 1. If you want to test whether type of student modifies the association between hours of sleep per night and daily productivity score, which model (from attached image) should you consider and what is the null hypothesis for this test? A. Use Model 3 and test H0: β2=0 B. Use Model 5 and test H0: β3=0 C. Use Model 5 and test H0: β1=0 D. Use Model 5 and test H0: β2=0 E. Use Model 2 and test H0: β1=0 2. Suppose that you decide to use Model 5 (from pocture attached) to describe the relationship between type of student, hours of sleep per night, and daily productivity score. You use the method of least squares to obtain the following: Y= -0.5 + 3(X1) + 1.5(X2) + 2.5(X1X2) What is the estimated slope relating hours of sleep per night and daily productivity score among undergraduate students? A. 2 B. None of these C. 0.5 D. 1.5 E. 2.5
Consider the following variables: Y=daily productivity score (measured in points) X1=0 if undergraduate student,1 if graduate student X2=hours of sleep per night 1. If you want to test whether type of student modifies the association between hours of sleep per night and daily productivity score, which model (from attached image) should you consider and what is the null hypothesis for this test? A. Use Model 3 and test H0: β2=0 B. Use Model 5 and test H0: β3=0 C. Use Model 5 and test H0: β1=0 D. Use Model 5 and test H0: β2=0 E. Use Model 2 and test H0: β1=0 2. Suppose that you decide to use Model 5 (from pocture attached) to describe the relationship between type of student, hours of sleep per night, and daily productivity score. You use the method of least squares to obtain the following: Y= -0.5 + 3(X1) + 1.5(X2) + 2.5(X1X2) What is the estimated slope relating hours of sleep per night and daily productivity score among undergraduate students? A. 2 B. None of these C. 0.5 D. 1.5 E. 2.5
MATLAB: An Introduction with Applications
6th Edition
ISBN:9781119256830
Author:Amos Gilat
Publisher:Amos Gilat
Chapter1: Starting With Matlab
Section: Chapter Questions
Problem 1P
Related questions
Question
Consider the following variables:
Y=daily productivity score (measured in points)
X1=0 if undergraduate student,1 if graduate student
X2=hours of sleep per night
1. If you want to test whether type of student modifies the association between hours of sleep per night and daily productivity score, which model (from attached image) should you consider and what is the null hypothesis for this test?
A. Use Model 3 and test H0: β2=0
B. Use Model 5 and test H0: β3=0
C. Use Model 5 and test H0: β1=0
D. Use Model 5 and test H0: β2=0
E. Use Model 2 and test H0: β1=0
2. Suppose that you decide to use Model 5 (from pocture attached) to describe the relationship between type of student, hours of sleep per night, and daily productivity score. You use the method of least squares to obtain the following:
Y= -0.5 + 3(X1) + 1.5(X2) + 2.5(X1X2)
What is the estimated slope relating hours of sleep per night and daily productivity score among undergraduate students?
A. 2
B. None of these
C. 0.5
D. 1.5
E. 2.5

Transcribed Image Text:Mean Y
X₁ = 1
X₁ = 0
(a)
X2

Transcribed Image Text:Model 5: Y = B₁ + B₁X₁ + B₂X₂ + B3X₁X₂ + ε
Model 3: Y = ß0 + ß₂X₂ + ε
E
Model 1: Y = Bo
Model 2: Y = Bo + ß₁X₁ + ε
Model 4: Y = Bo + B₁X₁ + B₂X₂ + ε
F2
17
#
20
F3
$
000
000
F4
X₁ = 0
0/
F5
(a)
O G
+2
Expert Solution
This question has been solved!
Explore an expertly crafted, step-by-step solution for a thorough understanding of key concepts.
This is a popular solution!
Trending now
This is a popular solution!
Step by step
Solved in 3 steps with 5 images

Follow-up Questions
Read through expert solutions to related follow-up questions below.
Follow-up Question
How about these?

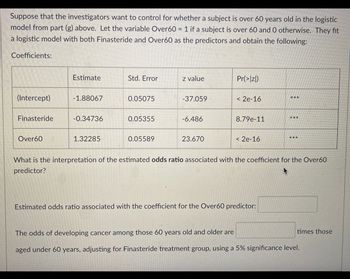
Transcribed Image Text:Suppose that the investigators want to control for whether a subject is over 60 years old in the logistic
model from part (g) above. Let the variable Over60 = 1 if a subject is over 60 and 0 otherwise. They fit
a logistic model with both Finasteride and Over60 as the predictors and obtain the following:
Coefficients:
(Intercept)
Finasteride
Over60
Estimate
-1.88067
-0.34736
1.32285
Std. Error
0.05075
0.05355
0.05589
z value
-37.059
-6.486
23.670
Pr(>|z|)
< 2e-16
8.79e-11
< 2e-16
***
Estimated odds ratio associated with the coefficient for the Over60 predictor:
***
***
What is the interpretation of the estimated odds ratio associated with the coefficient for the Over60
predictor?
times those
The odds of developing cancer among those 60 years old and older are
aged under 60 years, adjusting for Finasteride treatment group, using a 5% significance level.

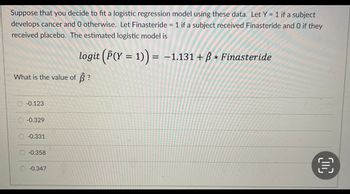
Transcribed Image Text:Suppose that you decide to fit a logistic regression model using these data. Let Y = 1 if a subject
develops cancer and 0 otherwise. Let Finasteride = 1 if a subject received Finasteride and O if they
received placebo. The estimated logistic model is
logit (P(Y = 1)) = −1.131 + ß * Finasteride
What is the value of ?
-0.123
-0.329
-0.331
-0.358
-0.347
€
Solution
Recommended textbooks for you

MATLAB: An Introduction with Applications
Statistics
ISBN:
9781119256830
Author:
Amos Gilat
Publisher:
John Wiley & Sons Inc

Probability and Statistics for Engineering and th…
Statistics
ISBN:
9781305251809
Author:
Jay L. Devore
Publisher:
Cengage Learning

Statistics for The Behavioral Sciences (MindTap C…
Statistics
ISBN:
9781305504912
Author:
Frederick J Gravetter, Larry B. Wallnau
Publisher:
Cengage Learning

MATLAB: An Introduction with Applications
Statistics
ISBN:
9781119256830
Author:
Amos Gilat
Publisher:
John Wiley & Sons Inc

Probability and Statistics for Engineering and th…
Statistics
ISBN:
9781305251809
Author:
Jay L. Devore
Publisher:
Cengage Learning

Statistics for The Behavioral Sciences (MindTap C…
Statistics
ISBN:
9781305504912
Author:
Frederick J Gravetter, Larry B. Wallnau
Publisher:
Cengage Learning

Elementary Statistics: Picturing the World (7th E…
Statistics
ISBN:
9780134683416
Author:
Ron Larson, Betsy Farber
Publisher:
PEARSON

The Basic Practice of Statistics
Statistics
ISBN:
9781319042578
Author:
David S. Moore, William I. Notz, Michael A. Fligner
Publisher:
W. H. Freeman

Introduction to the Practice of Statistics
Statistics
ISBN:
9781319013387
Author:
David S. Moore, George P. McCabe, Bruce A. Craig
Publisher:
W. H. Freeman