Consider the following time series data. Quarter 1 2 3 4 Year 1 3 1 1 4 Year 2 5 2 4 5 Year 3 7 6 7 6
Consider the following time series data. Quarter 1 2 3 4 Year 1 3 1 1 4 Year 2 5 2 4 5 Year 3 7 6 7 6
MATLAB: An Introduction with Applications
6th Edition
ISBN:9781119256830
Author:Amos Gilat
Publisher:Amos Gilat
Chapter1: Starting With Matlab
Section: Chapter Questions
Problem 1P
Related questions
Question
Consider the following time series data.
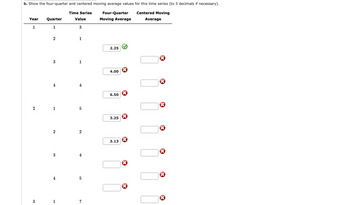
a. Show the four-quarter and centered moving average values for this time series (to 3 decimals if necessary).
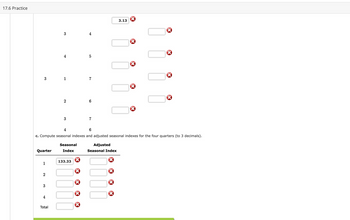
b. Compute seasonal indexes and adjusted seasonal indexes for the four quarters (to 3 decimals).

Transcribed Image Text:Consider the following time series data.
Quarter
1
2
3
4
Year 1
3
1
1
4
Year 2
5
2
4
5
Year 3
7
6
7
6
Expert Solution
This question has been solved!
Explore an expertly crafted, step-by-step solution for a thorough understanding of key concepts.
Step by step
Solved in 3 steps

Follow-up Questions
Read through expert solutions to related follow-up questions below.
Follow-up Question
please provide correct answers and a good format table.I will also attach some pictures how the table should be.

Transcribed Image Text:### Four-Quarter and Centered Moving Average Calculation for a Time Series
This section demonstrates the calculation of four-quarter and centered moving average values for a given time series. The objective is to provide a step-by-step guide, helping students understand the process thoroughly.
The table below contains the time series data along with incorrect and correct moving averages for comparison. The values should be calculated up to three decimal places if necessary.
#### Data Table
| Year | Quarter | Time Series Value | Four-Quarter Moving Average | Centered Moving Average |
|------|---------|-------------------|-----------------------------|--------------------------|
| 1 | 1 | 3 | | |
| | 2 | 1 | 2.25 ✓ | |
| | 3 | 1 | 4.00 ✗ | |
| | 4 | 4 | 6.50 ✗ | |
| 2 | 1 | 5 | 3.25 ✗ | |
| | 2 | 2 | 3.13 ✗ | |
| | 3 | 4 | | |
| | 4 | 5 | | |
| 3 | 1 | 7 | | |
#### Detailed Explanation:
1. **Four-Quarter Moving Average Calculation**:
- It is computed by taking the average of the time series values over four quarters. For this example, erroneous computations were indicated with a red cross (✗), while the correct calculation has been indicated with a green checkmark (✓).
2. **Centered Moving Average**:
- The centered moving average is calculated by averaging two successive four-quarter moving averages. This adjustment is needed because the simple four-quarter moving average places the average in the middle of the period.
For example:
- For the second quarter in Year 1, the correct four-quarter moving average is **2.25**, which is verified by the green checkmark.
**Note**: Further computation steps for comparisons and more accurate calculations can be included during exercises or further in-depth analysis within classes.

Transcribed Image Text:### 17.6 Practice
#### Instructions
**c. Compute seasonal indexes and adjusted seasonal indexes for the four quarters (to 3 decimals).**
#### Diagram
The diagram in this practice consists of two main sections:
1. **Index Values and Empty Input Fields:**
- This section displays various number pairs and empty input fields in a table format.
- The only pre-filled value in this table is "3.13" given with no specific row or column heading.
- Below this, several pairs of numbers are listed in a block-like format, with corresponding empty input fields aligned to the right, each followed by a red cross (indicating errors or missing values).
2. **Seasonal Index Table:**
- This table has four rows under the header row and three columns – "Quarter," "Seasonal Index," and "Adjusted Seasonal Index."
- The first row has "Quarter 1" under the "Quarter" column and "133.33" under the "Seasonal Index" column; the "Adjusted Seasonal Index" field is empty and marked by a red cross.
- Quarters 2, 3, and 4 are listed with all corresponding fields empty and marked by red crosses.
- The last row is labeled "Total," and all fields are empty and marked by red crosses.
#### Instructions for Completion:
- Calculate and fill in the seasonal indexes and adjusted seasonal indexes for quarters 1 through 4.
- Ensure all calculations are accurate to three decimal places.
- Sum up all values in the "Total" row accordingly.
Solution
Recommended textbooks for you

MATLAB: An Introduction with Applications
Statistics
ISBN:
9781119256830
Author:
Amos Gilat
Publisher:
John Wiley & Sons Inc

Probability and Statistics for Engineering and th…
Statistics
ISBN:
9781305251809
Author:
Jay L. Devore
Publisher:
Cengage Learning

Statistics for The Behavioral Sciences (MindTap C…
Statistics
ISBN:
9781305504912
Author:
Frederick J Gravetter, Larry B. Wallnau
Publisher:
Cengage Learning

MATLAB: An Introduction with Applications
Statistics
ISBN:
9781119256830
Author:
Amos Gilat
Publisher:
John Wiley & Sons Inc

Probability and Statistics for Engineering and th…
Statistics
ISBN:
9781305251809
Author:
Jay L. Devore
Publisher:
Cengage Learning

Statistics for The Behavioral Sciences (MindTap C…
Statistics
ISBN:
9781305504912
Author:
Frederick J Gravetter, Larry B. Wallnau
Publisher:
Cengage Learning

Elementary Statistics: Picturing the World (7th E…
Statistics
ISBN:
9780134683416
Author:
Ron Larson, Betsy Farber
Publisher:
PEARSON

The Basic Practice of Statistics
Statistics
ISBN:
9781319042578
Author:
David S. Moore, William I. Notz, Michael A. Fligner
Publisher:
W. H. Freeman

Introduction to the Practice of Statistics
Statistics
ISBN:
9781319013387
Author:
David S. Moore, George P. McCabe, Bruce A. Craig
Publisher:
W. H. Freeman