Consider the following set of ungrouped sample data. Answer parts A through D. 4 4 4 4 1 2 2 6 7 80 (A) Find the mean and standard deviation of the ungrouped sample data. x= (Type an integer or a decimal.) S= (Type an integer or decimal rounded to three decimal places as needed.) (B) What proportion of the measurements lies within 1 standard deviation of the mean? Within 2 standard deviations? Within 3 standard deviations? % of the data values fall within 1 standard deviation of the mean. % of the data values fall within 2 standard deviations of the mean. % of the data values fall within 3 standard deviations of the mean.
Consider the following set of ungrouped sample data. Answer parts A through D. 4 4 4 4 1 2 2 6 7 80 (A) Find the mean and standard deviation of the ungrouped sample data. x= (Type an integer or a decimal.) S= (Type an integer or decimal rounded to three decimal places as needed.) (B) What proportion of the measurements lies within 1 standard deviation of the mean? Within 2 standard deviations? Within 3 standard deviations? % of the data values fall within 1 standard deviation of the mean. % of the data values fall within 2 standard deviations of the mean. % of the data values fall within 3 standard deviations of the mean.
Advanced Engineering Mathematics
10th Edition
ISBN:9780470458365
Author:Erwin Kreyszig
Publisher:Erwin Kreyszig
Chapter2: Second-order Linear Odes
Section: Chapter Questions
Problem 1RQ
Related questions
Question
Please help!!

Transcribed Image Text:Consider the following set of ungrouped sample data. Answer parts A through D.
4 4 4 4 12 2 67 80
(A) Find the mean and standard deviation of the ungrouped sample data.
x= (Type an integer or a decimal.)
S= (Type an integer or decimal rounded to three decimal places as needed.)
(B) What proportion of the measurements lies within 1 standard deviation of the mean? Within 2 standard deviations? Within 3 standard deviations?
% of the data values fall within 1 standard deviation of the mean.
% of the data values fall within 2 standard deviations of the mean.
% of the data values fall within 3 standard deviations of the mean.
Expert Solution
This question has been solved!
Explore an expertly crafted, step-by-step solution for a thorough understanding of key concepts.
This is a popular solution!
Trending now
This is a popular solution!
Step by step
Solved in 3 steps with 2 images

Follow-up Questions
Read through expert solutions to related follow-up questions below.
Follow-up Question
What would the histogram look like?

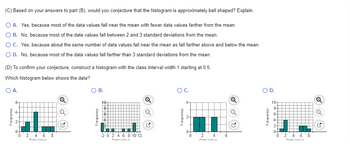
Transcribed Image Text:(C) Based on your answers to part (B), would you conjecture that the histogram is approximately bell shaped? Explain.
O A. Yes, because most of the data values fall near the mean with fewer data values farther from the mean.
O B. No, because most of the data values fall between 2 and 3 standard deviations from the mean.
O C. Yes, because about the same number of data values fall near the mean as fall farther above and below the mean.
O D. No, because most of the data values fall farther than 3 standard deviations from the mean.
(D) To confirm your conjecture, construct a histogram with the class interval width 1 starting at 0.5.
Which histogram below shows the data?
O A.
6-
CIL
Frequency
0 2 4 6 8
Din Valm
Q
Q
O B.
M
T ………
-20 2 4 6 8 10 12
Q
Q
OC.
0
2
Data Valon
6
Q
Q
O D.
10-
8+
6-
0-
0
-N
2
4
Dats Valus
||
Q
3-
Solution
Recommended textbooks for you

Advanced Engineering Mathematics
Advanced Math
ISBN:
9780470458365
Author:
Erwin Kreyszig
Publisher:
Wiley, John & Sons, Incorporated

Numerical Methods for Engineers
Advanced Math
ISBN:
9780073397924
Author:
Steven C. Chapra Dr., Raymond P. Canale
Publisher:
McGraw-Hill Education

Introductory Mathematics for Engineering Applicat…
Advanced Math
ISBN:
9781118141809
Author:
Nathan Klingbeil
Publisher:
WILEY

Advanced Engineering Mathematics
Advanced Math
ISBN:
9780470458365
Author:
Erwin Kreyszig
Publisher:
Wiley, John & Sons, Incorporated

Numerical Methods for Engineers
Advanced Math
ISBN:
9780073397924
Author:
Steven C. Chapra Dr., Raymond P. Canale
Publisher:
McGraw-Hill Education

Introductory Mathematics for Engineering Applicat…
Advanced Math
ISBN:
9781118141809
Author:
Nathan Klingbeil
Publisher:
WILEY

Mathematics For Machine Technology
Advanced Math
ISBN:
9781337798310
Author:
Peterson, John.
Publisher:
Cengage Learning,

