
Elementary Geometry For College Students, 7e
7th Edition
ISBN:9781337614085
Author:Alexander, Daniel C.; Koeberlein, Geralyn M.
Publisher:Alexander, Daniel C.; Koeberlein, Geralyn M.
ChapterP: Preliminary Concepts
SectionP.CT: Test
Problem 1CT

Related questions
Question
100%
Consider the Figure Below
![**Question:**
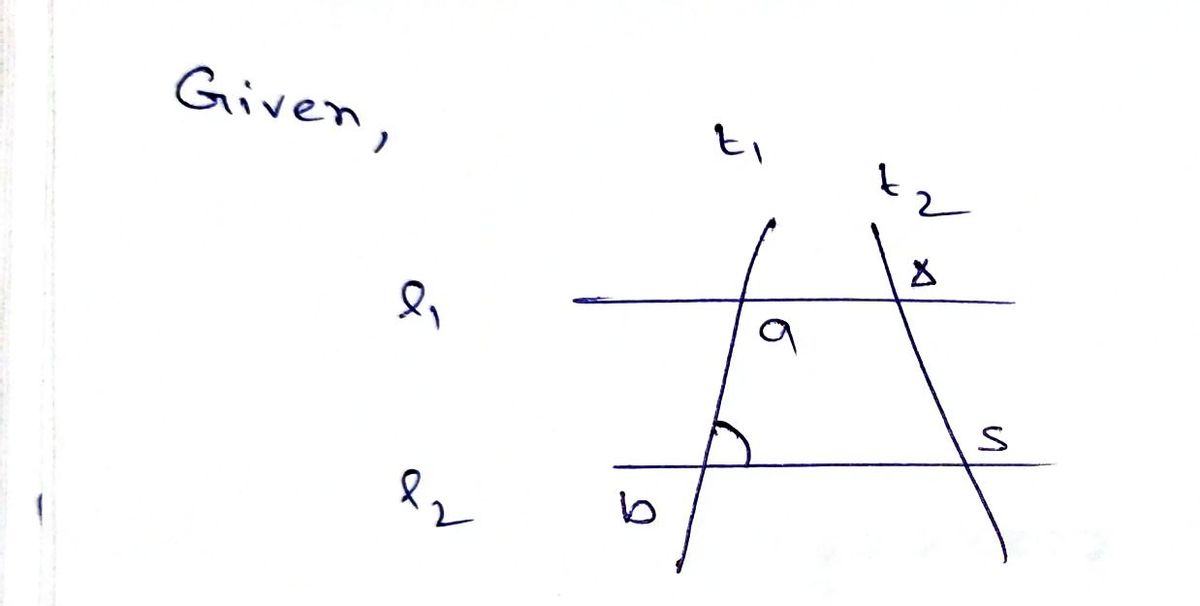
Consider the figure below in which \( l_1 \parallel l_2 \). \( m\angle a = 13y \), \( m\angle b = 31y + 4 \), \( m\angle r = 30x + 40 \), and \( m\angle s = 130x - 160 \).
[Diagram Description:]
- The figure shows two parallel lines \( l_1 \) and \( l_2 \).
- There are two transversals, \( t_1 \) and \( t_2 \), intersecting these parallel lines.
- The angles formed at the intersections are labeled as follows:
- \( \angle a \) at the intersection of \( t_1 \) and \( l_1 \).
- \( \angle b \) at the intersection of \( t_2 \) and \( l_2 \).
- \( \angle r \) between \( l_1 \) and \( l_2 \), adjacent to both transversals on the top.
- \( \angle s \) between \( l_1 \) and \( l_2 \), adjacent to both transversals on the bottom.
**Problem:**
What are the values of \( \angle a \), \( \angle b \), \( \angle r \), and \( \angle s \)?
**Spaces for Answers:**
\[
\begin{align*}
\angle a &= \, \underline{\hspace{2cm}} \\
\angle b &= \, \underline{\hspace{2cm}} \\
\angle r &= \, \underline{\hspace{2cm}} \\
\angle s &= \, \underline{\hspace{2cm}} \\
\end{align*}
\]
**Answer:**
[Answer content would be provided here based on solving the equations.]](/v2/_next/image?url=https%3A%2F%2Fcontent.bartleby.com%2Fqna-images%2Fquestion%2F8414336b-b479-4cd8-a770-2cae901edff9%2Fcff8927a-1804-409f-8810-84255c8ee7cc%2F9xcqa6b_processed.png&w=3840&q=75)
Transcribed Image Text:**Question:**
Consider the figure below in which \( l_1 \parallel l_2 \). \( m\angle a = 13y \), \( m\angle b = 31y + 4 \), \( m\angle r = 30x + 40 \), and \( m\angle s = 130x - 160 \).
[Diagram Description:]
- The figure shows two parallel lines \( l_1 \) and \( l_2 \).
- There are two transversals, \( t_1 \) and \( t_2 \), intersecting these parallel lines.
- The angles formed at the intersections are labeled as follows:
- \( \angle a \) at the intersection of \( t_1 \) and \( l_1 \).
- \( \angle b \) at the intersection of \( t_2 \) and \( l_2 \).
- \( \angle r \) between \( l_1 \) and \( l_2 \), adjacent to both transversals on the top.
- \( \angle s \) between \( l_1 \) and \( l_2 \), adjacent to both transversals on the bottom.
**Problem:**
What are the values of \( \angle a \), \( \angle b \), \( \angle r \), and \( \angle s \)?
**Spaces for Answers:**
\[
\begin{align*}
\angle a &= \, \underline{\hspace{2cm}} \\
\angle b &= \, \underline{\hspace{2cm}} \\
\angle r &= \, \underline{\hspace{2cm}} \\
\angle s &= \, \underline{\hspace{2cm}} \\
\end{align*}
\]
**Answer:**
[Answer content would be provided here based on solving the equations.]
Expert Solution
Step 1

Step by step
Solved in 2 steps with 2 images

Recommended textbooks for you
Elementary Geometry For College Students, 7e
Geometry
ISBN:
9781337614085
Author:
Alexander, Daniel C.; Koeberlein, Geralyn M.
Publisher:
Cengage,

Elementary Geometry for College Students
Geometry
ISBN:
9781285195698
Author:
Daniel C. Alexander, Geralyn M. Koeberlein
Publisher:
Cengage Learning
Elementary Geometry For College Students, 7e
Geometry
ISBN:
9781337614085
Author:
Alexander, Daniel C.; Koeberlein, Geralyn M.
Publisher:
Cengage,
Elementary Geometry for College Students
Geometry
ISBN:
9781285195698
Author:
Daniel C. Alexander, Geralyn M. Koeberlein
Publisher:
Cengage Learning