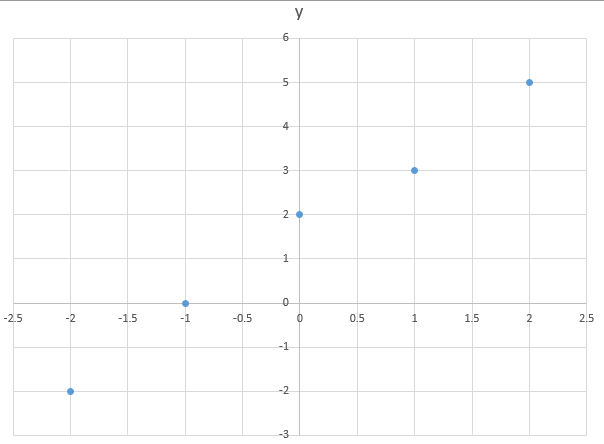
Consider the data set given in the accompanying table. Complete parts (a) through (c). E Click the icon to view the data table. (a) Draw a scatter diagram treating x as the explanatory variable an Xbelow. Data Table O A. OB. OD. Ay - 2 -1 0 2 y -2 0 Print Done


Inverse Normal Distribution
The method used for finding the corresponding z-critical value in a normal distribution using the known probability is said to be an inverse normal distribution. The inverse normal distribution is a continuous probability distribution with a family of two parameters.
Mean, Median, Mode
It is a descriptive summary of a data set. It can be defined by using some of the measures. The central tendencies do not provide information regarding individual data from the dataset. However, they give a summary of the data set. The central tendency or measure of central tendency is a central or typical value for a probability distribution.
Z-Scores
A z-score is a unit of measurement used in statistics to describe the position of a raw score in terms of its distance from the mean, measured with reference to standard deviation from the mean. Z-scores are useful in statistics because they allow comparison between two scores that belong to different normal distributions.


for the above data y is response variable and x is explanatory variable .
hence the scatter plot is

Trending now
This is a popular solution!

Step by step
Solved in 2 steps with 1 images


