Conduct a hypothesis test showing all of your steps. A study claims that all adults spend an average of over 14 hours on chores during a weekend. In a random sample of 172 adults spent a mean time of 14.38 hours of time on weekend chores, with a standard deviation of 2.6 hours. Test this claim with a 6% level of significance. 1. State the hypotheses and label the claim. Is the test left-tailed, right-tailed, or two-tailed? 2.What is/are the critical value(s)? Draw a picture. 3.What is the P-value AND test-statistic? 4. State the conclusion. Give two rea
Show all steps/ calculator commands used.
Conduct a hypothesis test showing all of your steps.
A study claims that all adults spend an average of over 14 hours on chores during a weekend. In a random sample of 172 adults spent a mean time of 14.38 hours of time on weekend chores, with a standard deviation of 2.6 hours. Test this claim with a 6% level of significance.
1. State the hypotheses and label the claim. Is the test left-tailed, right-tailed, or two-tailed?
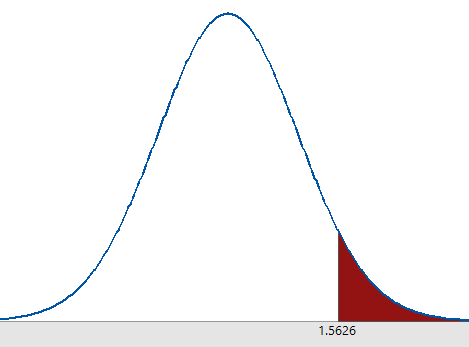
2.What is/are the critical value(s)? Draw a picture.
3.What is the P-value AND test-statistic?
4. State the conclusion. Give two reasons for your decision to reject/not reject H0 based on:
-Test statistic compared to critical value
- P-value compared to α
Then, relate back to the original claim.
Hello! As you have posted more than 3 sub parts, we are answering the first 3 sub-parts. In case you require the unanswered parts also, kindly re-post that parts separately.
1.
Given claim:
A study claims that all adults spend an average of over 14 hours on chores during a weekend.
Null Hypothesis:
Alternative Hypothesis:
Here, the alternative is greater than case.
Hence, the tail of the test is right tail test.
2.
Here, the population standard deviation is not known.
Hence, we can use t test.
Given sample size is n=172
df=n-1=172-1=171
Level of significance=6%=0.06
t critical value=1.5626, from the excel function, =T.INV(0.94,171).
Graph:

Step by step
Solved in 3 steps with 1 images


