Compute the cumulative income share and neatly plot (using Excel) the Lorenz curve for these two countries with labels. Feel free to use excel template that I have uploaded and copy paste the plot. Compute the Gini coefficient assuming the region beneath the two respective Lorenz curve is For country A = 0.2875 For country B = 0.3250 %3D
Compute the cumulative income share and neatly plot (using Excel) the Lorenz curve for these two countries with labels. Feel free to use excel template that I have uploaded and copy paste the plot. Compute the Gini coefficient assuming the region beneath the two respective Lorenz curve is For country A = 0.2875 For country B = 0.3250 %3D

Chapter1: Making Economics Decisions
Section: Chapter Questions
Problem 1QTC

Related questions
Question
![Q2] Given is the data for Country A and B:
Population
Fraction
Country A's
Income
Country B's
Income
bottom 25%
5 million
10 million
2nd 25%
10 million
15 million
3rd 25%
30 million
20 million
top 25%
55 million
55 million
a) Compute the cumulative income share and neatly plot (using
Excel) the Lorenz curve for these two countries with labels. Feel
free to use excel template that I have uploaded and copy paste the
plot.
b) Compute the Gini coefficient assuming the region beneath the two
respective Lorenz curve is
For country A = 0.2875
For country B = 0.3250](/v2/_next/image?url=https%3A%2F%2Fcontent.bartleby.com%2Fqna-images%2Fquestion%2Fd920f800-7cb4-4708-a86f-fdc64006663e%2Ffdcc5455-b120-4dfa-aad0-c2da0050c516%2Fbxbu3sn_processed.png&w=3840&q=75)
Transcribed Image Text:Q2] Given is the data for Country A and B:
Population
Fraction
Country A's
Income
Country B's
Income
bottom 25%
5 million
10 million
2nd 25%
10 million
15 million
3rd 25%
30 million
20 million
top 25%
55 million
55 million
a) Compute the cumulative income share and neatly plot (using
Excel) the Lorenz curve for these two countries with labels. Feel
free to use excel template that I have uploaded and copy paste the
plot.
b) Compute the Gini coefficient assuming the region beneath the two
respective Lorenz curve is
For country A = 0.2875
For country B = 0.3250
Expert Solution
Step 1
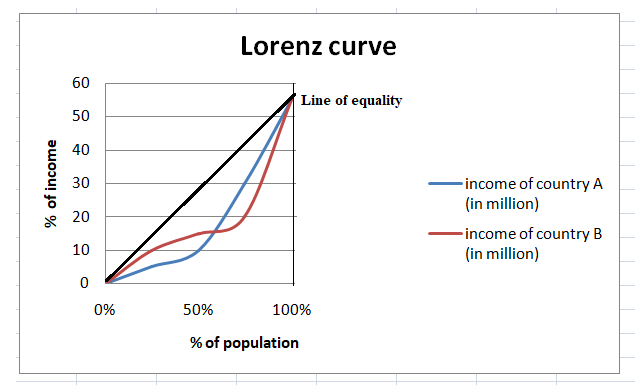
The Lorenz curve is the graphical representation of the measure income or wealth inequality of a nation. In the plot, the straight diagonal line (or 450 line) having a slope of 1 is the locus of perfect equality of income. The greater is the distance between the Lorenz curve and the straight line, the higher is the value of inequality in the country.
The following figure depicts the Lorenz curve of both the countries (A&B) which has been plotted using the data given in the question –

Step by step
Solved in 2 steps with 1 images

Knowledge Booster


Learn more about
Need a deep-dive on the concept behind this application? Look no further. Learn more about this topic, economics and related others by exploring similar questions and additional content below.Recommended textbooks for you

Principles of Economics (12th Edition)
Economics
ISBN:
9780134078779
Author:
Karl E. Case, Ray C. Fair, Sharon E. Oster
Publisher:
PEARSON

Engineering Economy (17th Edition)
Economics
ISBN:
9780134870069
Author:
William G. Sullivan, Elin M. Wicks, C. Patrick Koelling
Publisher:
PEARSON
Principles of Economics (12th Edition)
Economics
ISBN:
9780134078779
Author:
Karl E. Case, Ray C. Fair, Sharon E. Oster
Publisher:
PEARSON
Engineering Economy (17th Edition)
Economics
ISBN:
9780134870069
Author:
William G. Sullivan, Elin M. Wicks, C. Patrick Koelling
Publisher:
PEARSON

Principles of Economics (MindTap Course List)
Economics
ISBN:
9781305585126
Author:
N. Gregory Mankiw
Publisher:
Cengage Learning

Managerial Economics: A Problem Solving Approach
Economics
ISBN:
9781337106665
Author:
Luke M. Froeb, Brian T. McCann, Michael R. Ward, Mike Shor
Publisher:
Cengage Learning

Managerial Economics & Business Strategy (Mcgraw-…
Economics
ISBN:
9781259290619
Author:
Michael Baye, Jeff Prince
Publisher:
McGraw-Hill Education