Comment on the three types of candy and their sugar % based on the boxplot. Can any assumptions be made? Are the assumptions met? Explain. Sugar A В Candy 15
Comment on the three types of candy and their sugar % based on the boxplot. Can any assumptions be made? Are the assumptions met? Explain. Sugar A В Candy 15
MATLAB: An Introduction with Applications
6th Edition
ISBN:9781119256830
Author:Amos Gilat
Publisher:Amos Gilat
Chapter1: Starting With Matlab
Section: Chapter Questions
Problem 1P
Related questions
Question
Picture attached.

Transcribed Image Text:**Analysis of Candy Types and Sugar Percentage**
The boxplot above illustrates the sugar percentages for three different types of candy labeled as A, B, and C. The sugar percentage is displayed on the y-axis, while the types of candy are categorized on the x-axis.
### Description:
- **Candy A:**
- Median sugar percentage is around 7%.
- The interquartile range (IQR) is relatively narrow, indicating less variation in sugar content.
- The whiskers extend from about 5% to 9%, showing the minimum and maximum percentages within the range without outliers.
- **Candy B:**
- Median sugar percentage is approximately 6%.
- Similar to Candy A, the IQR is narrow, suggesting consistency.
- The whiskers also reflect a range from about 5% to 7%.
- **Candy C:**
- Median sugar percentage is significantly higher at around 14%.
- The IQR is wider compared to Candies A and B, indicating more variability in sugar content.
- Whiskers extend from about 11% to 17%.
### Observations:
- Candy C has a higher median sugar percentage compared to Candies A and B, which have similar medians.
- The spread of sugar content in Candy C is considerably wider, suggesting more variation within this type.
- Both Candies A and B have lower and similar sugar percentages, with relatively stable distributions.
### Assumptions and Analysis:
- **Assumptions can be made** about the consistency and sugar levels in different candy types. For instance, one might assume that higher variability in Candy C could be due to different flavor variants requiring different sugar levels.
- **Whether assumptions are met** depends on the specific questions or hypotheses being tested. If evaluating consistency, the assumption that Candies A and B have consistent sugar levels appears to be met, whereas Candy C's assumption of variability is also supported by the boxplot data.
### Conclusion:
The boxplot provides valuable insights into the sugar content variability and central tendencies among the different types of candy. Understanding these differences can be crucial for manufacturers, consumers, and nutritionists interested in sugar intake and quality control.
Expert Solution
Step 1
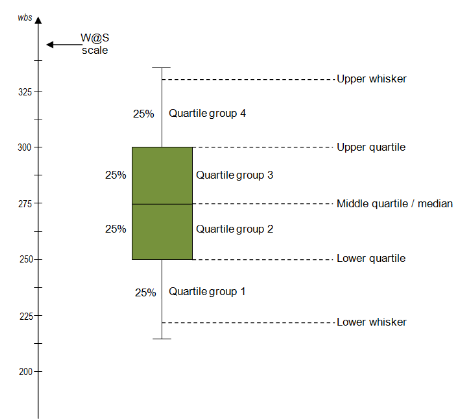
Box plots are drawn for percentage of sugar in different candies.
To begin with, percentages are sorted. Then four equal sized groups are made from the ordered percentages. That is, 25% of sugar are placed in each group. The lines dividing the groups are called quartiles, and the groups are referred to as quartile groups. Usually we label these groups 1 to 4 starting at the bottom.

Step by step
Solved in 2 steps with 1 images

Knowledge Booster
Learn more about
Need a deep-dive on the concept behind this application? Look no further. Learn more about this topic, statistics and related others by exploring similar questions and additional content below.Recommended textbooks for you

MATLAB: An Introduction with Applications
Statistics
ISBN:
9781119256830
Author:
Amos Gilat
Publisher:
John Wiley & Sons Inc

Probability and Statistics for Engineering and th…
Statistics
ISBN:
9781305251809
Author:
Jay L. Devore
Publisher:
Cengage Learning

Statistics for The Behavioral Sciences (MindTap C…
Statistics
ISBN:
9781305504912
Author:
Frederick J Gravetter, Larry B. Wallnau
Publisher:
Cengage Learning

MATLAB: An Introduction with Applications
Statistics
ISBN:
9781119256830
Author:
Amos Gilat
Publisher:
John Wiley & Sons Inc

Probability and Statistics for Engineering and th…
Statistics
ISBN:
9781305251809
Author:
Jay L. Devore
Publisher:
Cengage Learning

Statistics for The Behavioral Sciences (MindTap C…
Statistics
ISBN:
9781305504912
Author:
Frederick J Gravetter, Larry B. Wallnau
Publisher:
Cengage Learning

Elementary Statistics: Picturing the World (7th E…
Statistics
ISBN:
9780134683416
Author:
Ron Larson, Betsy Farber
Publisher:
PEARSON

The Basic Practice of Statistics
Statistics
ISBN:
9781319042578
Author:
David S. Moore, William I. Notz, Michael A. Fligner
Publisher:
W. H. Freeman

Introduction to the Practice of Statistics
Statistics
ISBN:
9781319013387
Author:
David S. Moore, George P. McCabe, Bruce A. Craig
Publisher:
W. H. Freeman