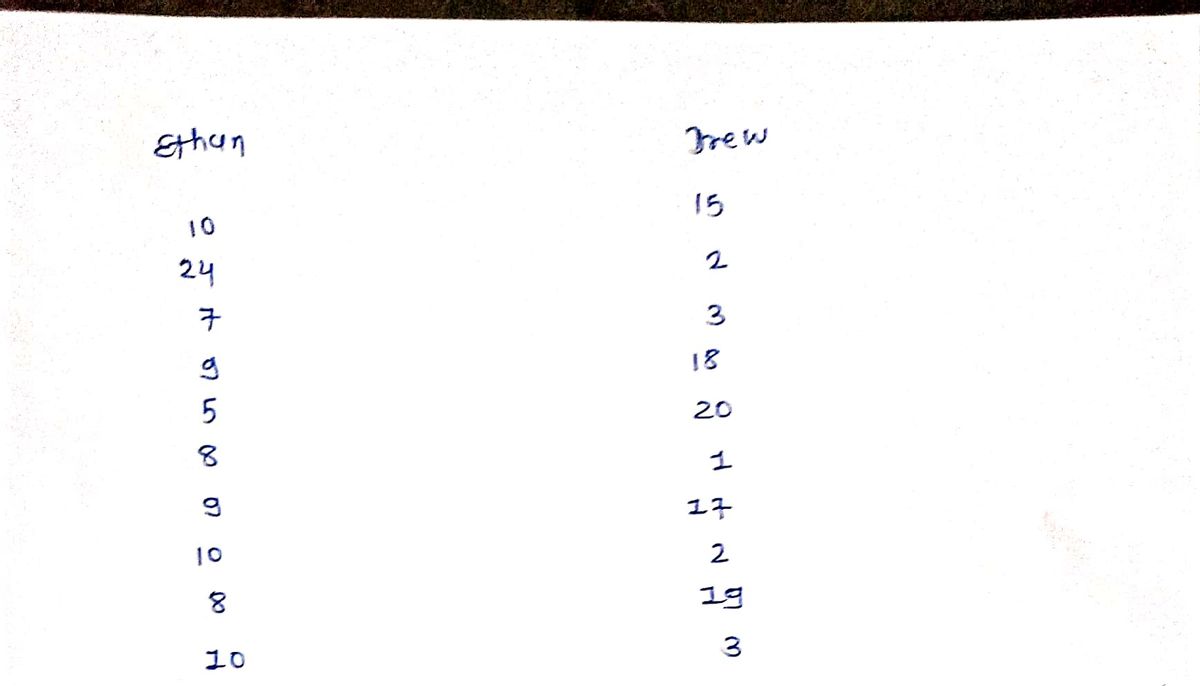
Click the icon to view the data table. iber of smalimouth bass caught and released by the two boys each day is shown in the accompanying data table. Complete parts (a) through (d) below. (a) Find the population mean and the range for the number of smallmouth bass caught per day by each fisherman. Do these values indicate any differences between the two fishermen's catches per day? The range for the number of smallmouth bass caught per day by Ethan is (Type an integer or a decimal. Do not round.) Data Table - X Ethan 10 Drew 24 7 9. 8. 9. 10 8. 10 15 2 18 20 17 19 3 Print Done Enter your answer in the answer box and then click Check Answer 12 parts remaining Clear All CAick A 300 AM P Type here to search 2/26/2021 TOUGHBOOK Panasonic C-54 TUN IRBAG Scroll Lock Pause Break Pritsc Nun Lock F9 F1 F11 FS F6 F7 F8 F2 F. F4 bysis F1 Es Back space & %3D @ 23 9 0 1 A1 2 42 E 51 (51 W 64 3:
Continuous Probability Distributions
Probability distributions are of two types, which are continuous probability distributions and discrete probability distributions. A continuous probability distribution contains an infinite number of values. For example, if time is infinite: you could count from 0 to a trillion seconds, billion seconds, so on indefinitely. A discrete probability distribution consists of only a countable set of possible values.
Normal Distribution
Suppose we had to design a bathroom weighing scale, how would we decide what should be the range of the weighing machine? Would we take the highest recorded human weight in history and use that as the upper limit for our weighing scale? This may not be a great idea as the sensitivity of the scale would get reduced if the range is too large. At the same time, if we keep the upper limit too low, it may not be usable for a large percentage of the population!


Step by step
Solved in 2 steps with 2 images


