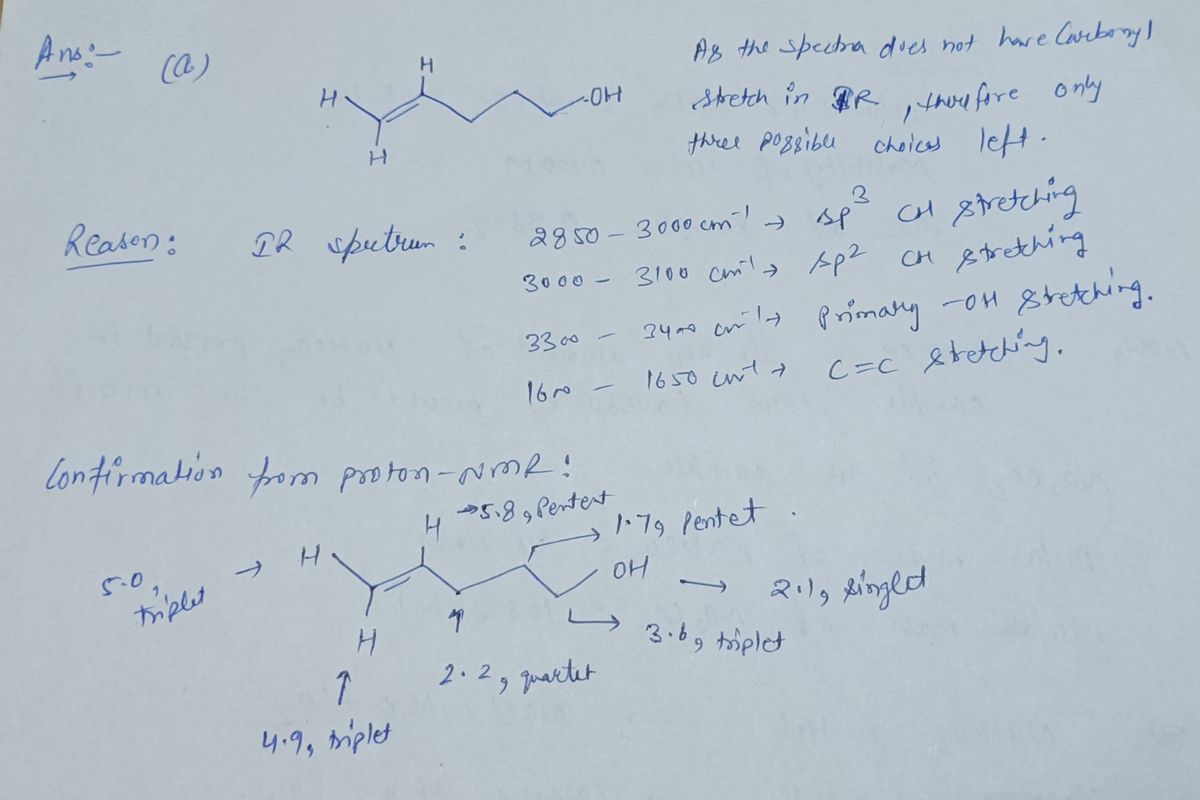
CHM 2410Z - Organic Chemistry I Lab 1) Consider the following molecules and choose the two represented by the spectra below. Use the IR spectra to narrow the possibilities, and then use the NMR data to confirm your choice. a. 1H NMR data: 85.8 ppm (1H, pentet) 85.0 ppm (1H, triplet) 84.9 ppm (1H, triplet) 83.6 ppm (2H, triplet) 8 2.2 ppm (2H, quartet) 82.1 ppm (1H, singlet) 8 1.7 ppm (2H, pentet) b. 1H NMR data: 8 2.4 ppm (2H, triplet) 82.1 ppm (3H, singlet) 8 1.6 ppm (2H, sextet) 80.9 ppm (3H, triplet) IR spectrum: IR/NMR Postlab IR spectrum: Relative Transmittance 0.8 0.6 0.4 0.2 0.8 0.6 0.4 0.2 3000 3000 OH H. 2000 H 2000 Wavenumber (cm-1) My H Wavenumber (cm-1) 1000 1000 OH


Analyzing Infrared Spectra
The electromagnetic radiation or frequency is classified into radio-waves, micro-waves, infrared, visible, ultraviolet, X-rays and gamma rays. The infrared spectra emission refers to the portion between the visible and the microwave areas of electromagnetic spectrum. This spectral area is usually divided into three parts, near infrared (14,290 – 4000 cm-1), mid infrared (4000 – 400 cm-1), and far infrared (700 – 200 cm-1), respectively. The number set is the number of the wave (cm-1).
IR Spectrum Of Cyclohexanone
It is the analysis of the structure of cyclohexaone using IR data interpretation.
IR Spectrum Of Anisole
Interpretation of anisole using IR spectrum obtained from IR analysis.
IR Spectroscopy
Infrared (IR) or vibrational spectroscopy is a method used for analyzing the particle's vibratory transformations. This is one of the very popular spectroscopic approaches employed by inorganic as well as organic laboratories because it is helpful in evaluating and distinguishing the frameworks of the molecules. The infra-red spectroscopy process or procedure is carried out using a tool called an infrared spectrometer to obtain an infrared spectral (or spectrophotometer).


Step by step
Solved in 2 steps with 2 images


