**Question 6** The following graphs can be used for the questions that follow: **Graph Descriptions:** 1. **Top Graph**: A plot of \([N_2O_5]\) versus time (min). - The x-axis represents time in minutes (min), ranging from 0 to 60. - The y-axis represents the concentration of \([N_2O_5]\), ranging from 0.2 to 0.8. - The data points form a curve that decreases over time, indicating a decrease in concentration as time progresses. 2. **Bottom Graph**: A plot of \(\ln [N_2O_5]\) versus time (min). - The x-axis represents time in minutes (min), ranging from 0 to 60. - The y-axis represents the natural logarithm of the concentration \(\ln [N_2O_5]\), ranging approximately from -1.9 to -0.4. - The data points form a straight line, indicating a linear relationship. The equation of the line is given by \(y = -0.0358x + 0.1058\). **Question:** Based on the preceding data, what is the rate constant for the reaction? - 3.33 min\(^{-1}\) - \(-0.0358\) min\(^{-1}\) - 0.0358 min\(^{-1}\) - 0.1058 min\(^{-1}\) **Instructions:** Click "Save and Submit" to save and submit. Click "Save All Answers" to save all answers.
**Question 6** The following graphs can be used for the questions that follow: **Graph Descriptions:** 1. **Top Graph**: A plot of \([N_2O_5]\) versus time (min). - The x-axis represents time in minutes (min), ranging from 0 to 60. - The y-axis represents the concentration of \([N_2O_5]\), ranging from 0.2 to 0.8. - The data points form a curve that decreases over time, indicating a decrease in concentration as time progresses. 2. **Bottom Graph**: A plot of \(\ln [N_2O_5]\) versus time (min). - The x-axis represents time in minutes (min), ranging from 0 to 60. - The y-axis represents the natural logarithm of the concentration \(\ln [N_2O_5]\), ranging approximately from -1.9 to -0.4. - The data points form a straight line, indicating a linear relationship. The equation of the line is given by \(y = -0.0358x + 0.1058\). **Question:** Based on the preceding data, what is the rate constant for the reaction? - 3.33 min\(^{-1}\) - \(-0.0358\) min\(^{-1}\) - 0.0358 min\(^{-1}\) - 0.1058 min\(^{-1}\) **Instructions:** Click "Save and Submit" to save and submit. Click "Save All Answers" to save all answers.

Chemistry
10th Edition
ISBN:9781305957404
Author:Steven S. Zumdahl, Susan A. Zumdahl, Donald J. DeCoste
Publisher:Steven S. Zumdahl, Susan A. Zumdahl, Donald J. DeCoste
Chapter1: Chemical Foundations
Section: Chapter Questions
Problem 1RQ: Define and explain the differences between the following terms. a. law and theory b. theory and...

Related questions
Question
![**Question 6**
The following graphs can be used for the questions that follow:
**Graph Descriptions:**
1. **Top Graph**: A plot of \([N_2O_5]\) versus time (min).
- The x-axis represents time in minutes (min), ranging from 0 to 60.
- The y-axis represents the concentration of \([N_2O_5]\), ranging from 0.2 to 0.8.
- The data points form a curve that decreases over time, indicating a decrease in concentration as time progresses.
2. **Bottom Graph**: A plot of \(\ln [N_2O_5]\) versus time (min).
- The x-axis represents time in minutes (min), ranging from 0 to 60.
- The y-axis represents the natural logarithm of the concentration \(\ln [N_2O_5]\), ranging approximately from -1.9 to -0.4.
- The data points form a straight line, indicating a linear relationship. The equation of the line is given by \(y = -0.0358x + 0.1058\).
**Question:**
Based on the preceding data, what is the rate constant for the reaction?
- 3.33 min\(^{-1}\)
- \(-0.0358\) min\(^{-1}\)
- 0.0358 min\(^{-1}\)
- 0.1058 min\(^{-1}\)
**Instructions:**
Click "Save and Submit" to save and submit. Click "Save All Answers" to save all answers.](/v2/_next/image?url=https%3A%2F%2Fcontent.bartleby.com%2Fqna-images%2Fquestion%2F824fa1c6-40a3-49c1-bdd2-6faa45715099%2F77dc811a-e8b3-42ec-a77c-246d2489f5c8%2F3b9k09s.jpeg&w=3840&q=75)
Transcribed Image Text:**Question 6**
The following graphs can be used for the questions that follow:
**Graph Descriptions:**
1. **Top Graph**: A plot of \([N_2O_5]\) versus time (min).
- The x-axis represents time in minutes (min), ranging from 0 to 60.
- The y-axis represents the concentration of \([N_2O_5]\), ranging from 0.2 to 0.8.
- The data points form a curve that decreases over time, indicating a decrease in concentration as time progresses.
2. **Bottom Graph**: A plot of \(\ln [N_2O_5]\) versus time (min).
- The x-axis represents time in minutes (min), ranging from 0 to 60.
- The y-axis represents the natural logarithm of the concentration \(\ln [N_2O_5]\), ranging approximately from -1.9 to -0.4.
- The data points form a straight line, indicating a linear relationship. The equation of the line is given by \(y = -0.0358x + 0.1058\).
**Question:**
Based on the preceding data, what is the rate constant for the reaction?
- 3.33 min\(^{-1}\)
- \(-0.0358\) min\(^{-1}\)
- 0.0358 min\(^{-1}\)
- 0.1058 min\(^{-1}\)
**Instructions:**
Click "Save and Submit" to save and submit. Click "Save All Answers" to save all answers.
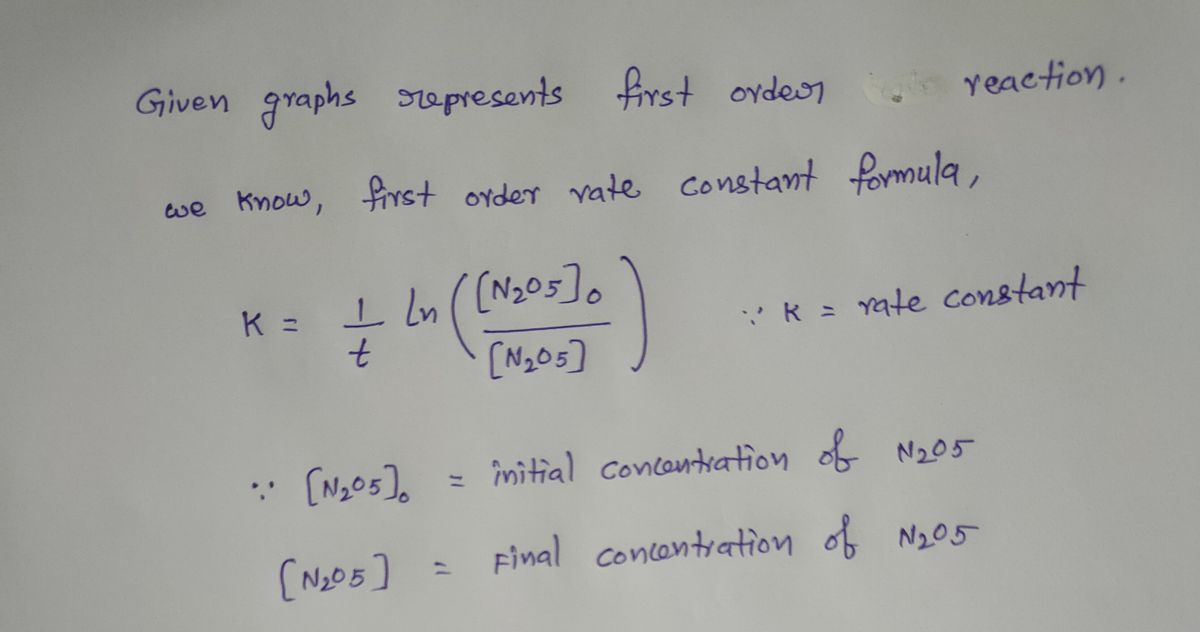
Expert Solution
Step 1

Step by step
Solved in 2 steps with 2 images

Recommended textbooks for you
Chemistry
Chemistry
ISBN:
9781305957404
Author:
Steven S. Zumdahl, Susan A. Zumdahl, Donald J. DeCoste
Publisher:
Cengage Learning

Chemistry
Chemistry
ISBN:
9781259911156
Author:
Raymond Chang Dr., Jason Overby Professor
Publisher:
McGraw-Hill Education

Principles of Instrumental Analysis
Chemistry
ISBN:
9781305577213
Author:
Douglas A. Skoog, F. James Holler, Stanley R. Crouch
Publisher:
Cengage Learning
Chemistry
Chemistry
ISBN:
9781305957404
Author:
Steven S. Zumdahl, Susan A. Zumdahl, Donald J. DeCoste
Publisher:
Cengage Learning
Chemistry
Chemistry
ISBN:
9781259911156
Author:
Raymond Chang Dr., Jason Overby Professor
Publisher:
McGraw-Hill Education
Principles of Instrumental Analysis
Chemistry
ISBN:
9781305577213
Author:
Douglas A. Skoog, F. James Holler, Stanley R. Crouch
Publisher:
Cengage Learning

Organic Chemistry
Chemistry
ISBN:
9780078021558
Author:
Janice Gorzynski Smith Dr.
Publisher:
McGraw-Hill Education

Chemistry: Principles and Reactions
Chemistry
ISBN:
9781305079373
Author:
William L. Masterton, Cecile N. Hurley
Publisher:
Cengage Learning

Elementary Principles of Chemical Processes, Bind…
Chemistry
ISBN:
9781118431221
Author:
Richard M. Felder, Ronald W. Rousseau, Lisa G. Bullard
Publisher:
WILEY