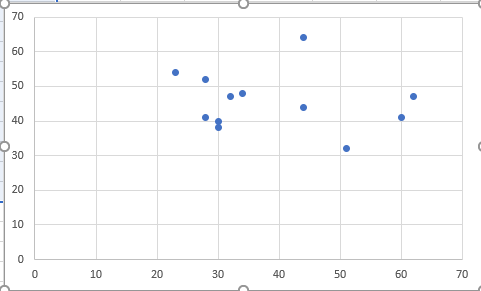
) Check Image Best Actress Best Actor 28 41 30 38 30 40 62 47
1) Check Image
Best Actress Best Actor
28 41
30 38
30 40
62 47
32 47
34 48
44 64
28 52
60 41
23 54
44 44
51 32
2)
The linear
(Round to three decimal places as needed.)
3)
Determine the null and alternative hypotheses.
H0: ρ
H1: ρ
(Type integers or decimals. Do not round.)
4)
The test statistic is t=
(Round to three decimal places as needed.)
5)
The P-value is
(Round to three decimal places as needed.)
6)
Because the P-value of the linear correlation coefficient is? the significance level, there? sufficient evidence to support the claim that there is a linear correlation between the ages of Best Actresses and Best Actors.
7) Check Image


Hello! As you have posted more than 3 sub parts, we are answering the first 3 sub-parts. In case you require the unanswered parts also, kindly re-post that parts separately.
1.
Scatter plot:
Excel Procedure:
Hello! As you have posted more than 3 sub parts, we are answering the first 3 sub-parts. In case you require the unanswered parts also, kindly re-post that parts separately.
Output:

Correct option: option B.
Step by step
Solved in 3 steps with 3 images


