
Algebra and Trigonometry (6th Edition)
6th Edition
ISBN:9780134463216
Author:Robert F. Blitzer
Publisher:Robert F. Blitzer
ChapterP: Prerequisites: Fundamental Concepts Of Algebra
Section: Chapter Questions
Problem 1MCCP: In Exercises 1-25, simplify the given expression or perform the indicated operation (and simplify,...

Related questions
Question
Can you help me?
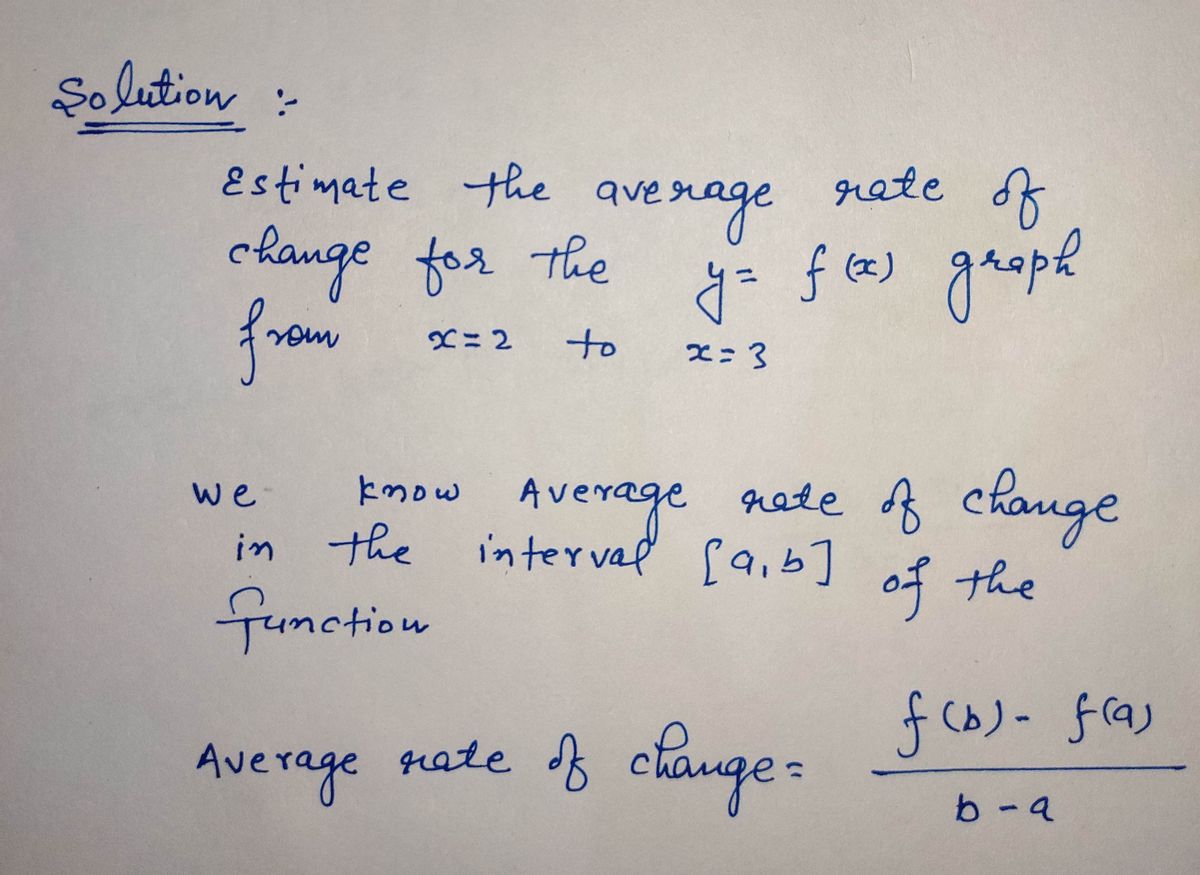
Estimate the average rate of change for the y=f(x) graph from x=2 to x=3?
Thank you! I'm having a rough time!

Transcribed Image Text:The image displays a plot of a mathematical function in a coordinate system. The graph is a smooth, continuous line, indicating some type of oscillatory or wave pattern.
### Graph Details:
- **Axes**:
- The horizontal axis (x-axis) ranges from approximately -0.2 to 5.
- The vertical axis (y-axis) is not fully visible at the top; the lower bound is around 1.0.
- **Curve Description**:
- The curve starts sharply at x = -0.2 and y = 1.0.
- The line rises steeply but then starts to oscillate, exhibiting peaks and troughs.
- Notable peaks and troughs suggest some periodic behavior, though irregular.
- **Plot Characteristics**:
- The graph is plotted in a bright blue color, making it distinct against the background.
- Grid lines provide reference points for better understanding the behavior of the function across the axes.
This graph is likely used to illustrate characteristics of a function in fields such as trigonometry, calculus, or engineering, where understanding waveforms or oscillations is essential.
Expert Solution
Step 1

Step by step
Solved in 2 steps with 2 images

Recommended textbooks for you
Algebra and Trigonometry (6th Edition)
Algebra
ISBN:
9780134463216
Author:
Robert F. Blitzer
Publisher:
PEARSON

Contemporary Abstract Algebra
Algebra
ISBN:
9781305657960
Author:
Joseph Gallian
Publisher:
Cengage Learning

Linear Algebra: A Modern Introduction
Algebra
ISBN:
9781285463247
Author:
David Poole
Publisher:
Cengage Learning
Algebra and Trigonometry (6th Edition)
Algebra
ISBN:
9780134463216
Author:
Robert F. Blitzer
Publisher:
PEARSON
Contemporary Abstract Algebra
Algebra
ISBN:
9781305657960
Author:
Joseph Gallian
Publisher:
Cengage Learning
Linear Algebra: A Modern Introduction
Algebra
ISBN:
9781285463247
Author:
David Poole
Publisher:
Cengage Learning

Algebra And Trigonometry (11th Edition)
Algebra
ISBN:
9780135163078
Author:
Michael Sullivan
Publisher:
PEARSON

Introduction to Linear Algebra, Fifth Edition
Algebra
ISBN:
9780980232776
Author:
Gilbert Strang
Publisher:
Wellesley-Cambridge Press

College Algebra (Collegiate Math)
Algebra
ISBN:
9780077836344
Author:
Julie Miller, Donna Gerken
Publisher:
McGraw-Hill Education