Calories in Fast-Food Sandwiches Three popular fast-food restaurant franchises specializing in burgers were surveyed to find out the number of calories in their frequently ordered sandwiches. At the a=0.005 level of significance, can it be concluded that a difference in mean number of calories per burger exists? FF# 1 670 510 420 340 Part: 0 / 5 Send data to Excel Part 1 of 5 Part: 1 / 5 Part 2 of 5 State the hypotheses and identify the claim with the correct hypothesis. Ho H₁ H₂ H3 Claim H₁: At least one mean is different from the others. Not claim ▼ Part: 2/5 Part 3 of 5 Find the critical value. Use The F Distribution Table to find the critical value. Round the answer to two decimal places. The critical value is 0 F = 0 Part: 3/5 Part 4 of 5 FF# 2 410 300 250 Compute the test value. Round the intermediate answers and the final answer to two decimal places. Make the decision. 740 540 Reject Part: 4 / 5 Part 5 of 5 FF# 3 430 360 840 710 ▼ Summarize the results. the null hypothesis. There is enough evidence to support the claim that a difference in mean number of calories per burger exists. X 3 ob 5
Calories in Fast-Food Sandwiches Three popular fast-food restaurant franchises specializing in burgers were surveyed to find out the number of calories in their frequently ordered sandwiches. At the a=0.005 level of significance, can it be concluded that a difference in mean number of calories per burger exists? FF# 1 670 510 420 340 Part: 0 / 5 Send data to Excel Part 1 of 5 Part: 1 / 5 Part 2 of 5 State the hypotheses and identify the claim with the correct hypothesis. Ho H₁ H₂ H3 Claim H₁: At least one mean is different from the others. Not claim ▼ Part: 2/5 Part 3 of 5 Find the critical value. Use The F Distribution Table to find the critical value. Round the answer to two decimal places. The critical value is 0 F = 0 Part: 3/5 Part 4 of 5 FF# 2 410 300 250 Compute the test value. Round the intermediate answers and the final answer to two decimal places. Make the decision. 740 540 Reject Part: 4 / 5 Part 5 of 5 FF# 3 430 360 840 710 ▼ Summarize the results. the null hypothesis. There is enough evidence to support the claim that a difference in mean number of calories per burger exists. X 3 ob 5

MATLAB: An Introduction with Applications
6th Edition
ISBN:9781119256830
Author:Amos Gilat
Publisher:Amos Gilat
Chapter1: Starting With Matlab
Section: Chapter Questions
Problem 1P

Related questions
Question
Urgent

Transcribed Image Text:Calories in Fast-Food Sandwiches Three popular fast-food restaurant franchises specializing in burgers were
surveyed to find out the number of calories in their frequently ordered sandwiches. At the a=0.005 level of
significance, can it be concluded that a difference in mean number of calories per burger exists?
FF# 1
670
510
420
340
Part: 0/5
Send data to Excel
Part 1 of 5
Part: 1 / 5
Part 2 of 5
State the hypotheses and identify the claim with the correct hypothesis.
Ho H₁ H₂ H3 Claim
H₁: At least one mean is different from the others. Not claim
Part: 2 / 5
Part 3 of 5
F = 0
Find the critical value. Use The F Distribution Table to find the critical value. Round the answer to two
decimal places.
The critical value is 0
Part: 3/5
Part 4 of 5
FF# 2
410
300
250
Make the decision.
740
540
Compute the test value. Round the intermediate answers and the final answer to two decimal places.
Reject
Part: 4/5
Part 5 of 5
FF# 3
430
▼
360
840
710
Summarize the results.
▼ the null hypothesis.
There is
▾ enough evidence to support the claim that a difference in
mean number of calories per burger exists.
X
5
olo
圆

Transcribed Image Text:Movie Theater Attendance The data shown are the weekly admissions, in millions, of people attending movie
theaters over three different time periods. At a = 0.05, is there a difference in the means for the weekly attendance
for these time periods? Use the critical value method with tables.
1950-1974
56.4
38.6
26.9
19.3
18.5
Send data to Excel
Part: 0 / 5
Part 1 of 5
Assume that all variables are normally distributed, that the samples are independent, that the population
variances are equal, and that the samples are simple random samples, one from each of the populations.
1975-1990
16.7
19.0
19.5
Part: 1 / 5
Part 2 of 5
21.3
23.9
Identify the claim with the correct hypothesis.
Ho: M₁ M₂ M3 Not claim
H₁: At least one mean is different from the others. Claim
1991-2000
22.1
25.7
27.2
26.2
24.6
Part: 2 / 5
Find the critical value. Use The F Distribution Table to find the critical value. Round the answer to two
decimal places.
The critical value is 1.
Submit Assignment
Ⓒ2023 McGraw Hilll LLC. All Rights Reserved. Terms of Use | Privacy Center
Expert Solution
Step 1
As per the Bartleby guildlines we have to solve first question and rest can be reposted....
Given that
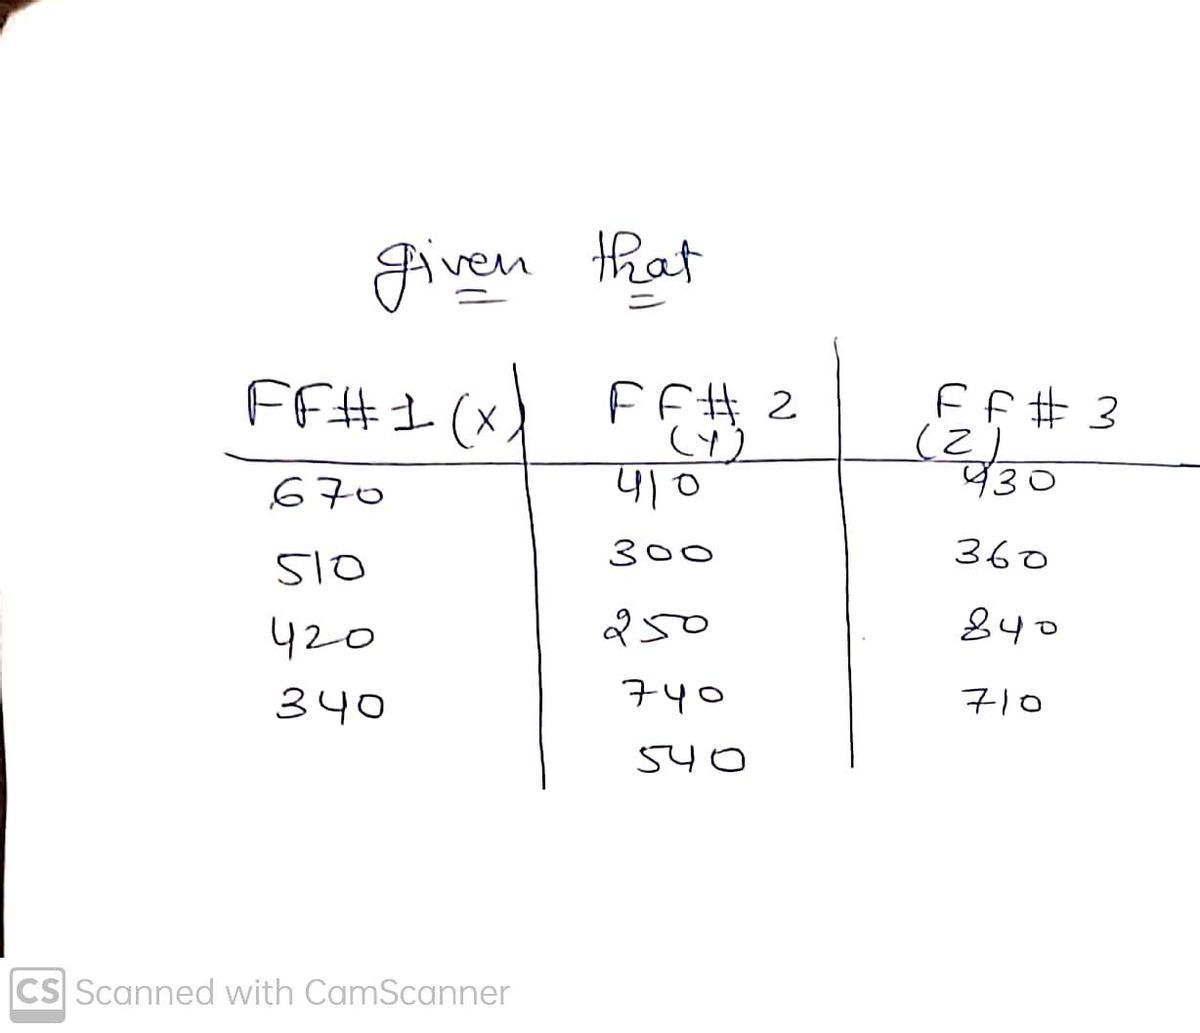
We have to test hypothesis for the claim that the difference in mean number of calories per burger exists at 0.05 level of significance

Trending now
This is a popular solution!

Step by step
Solved in 4 steps with 4 images

Recommended textbooks for you
MATLAB: An Introduction with Applications
Statistics
ISBN:
9781119256830
Author:
Amos Gilat
Publisher:
John Wiley & Sons Inc

Probability and Statistics for Engineering and th…
Statistics
ISBN:
9781305251809
Author:
Jay L. Devore
Publisher:
Cengage Learning

Statistics for The Behavioral Sciences (MindTap C…
Statistics
ISBN:
9781305504912
Author:
Frederick J Gravetter, Larry B. Wallnau
Publisher:
Cengage Learning
MATLAB: An Introduction with Applications
Statistics
ISBN:
9781119256830
Author:
Amos Gilat
Publisher:
John Wiley & Sons Inc
Probability and Statistics for Engineering and th…
Statistics
ISBN:
9781305251809
Author:
Jay L. Devore
Publisher:
Cengage Learning
Statistics for The Behavioral Sciences (MindTap C…
Statistics
ISBN:
9781305504912
Author:
Frederick J Gravetter, Larry B. Wallnau
Publisher:
Cengage Learning

Elementary Statistics: Picturing the World (7th E…
Statistics
ISBN:
9780134683416
Author:
Ron Larson, Betsy Farber
Publisher:
PEARSON

The Basic Practice of Statistics
Statistics
ISBN:
9781319042578
Author:
David S. Moore, William I. Notz, Michael A. Fligner
Publisher:
W. H. Freeman

Introduction to the Practice of Statistics
Statistics
ISBN:
9781319013387
Author:
David S. Moore, George P. McCabe, Bruce A. Craig
Publisher:
W. H. Freeman