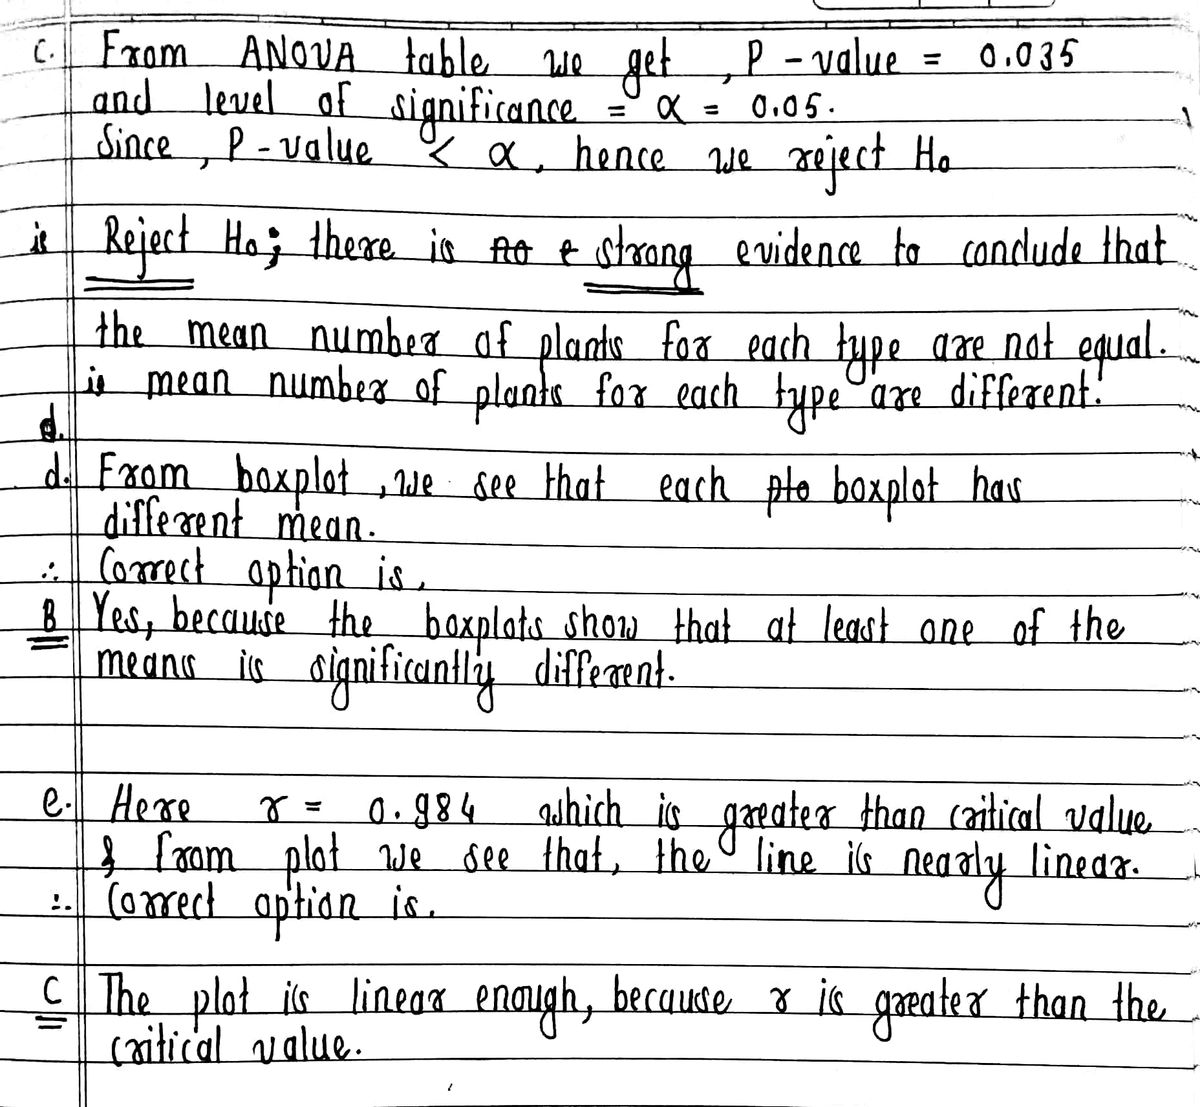
(c) Use the following one-way ANOVA table to test the hypothesis of equal means at the a0.05 level of significance. One-way ANOVA: Sludge Plot, Spring Disk, No Till Source DF 2 MS F 4.22 Factor 58.33 28.17 0.035 Error 15 100.17 6.68 Total 17 156.5 Should the null hypothesis be rejected? Ho; there is V evidence to conclude that the mean numbers of plants for each plot type are not equal. (d) Shown are side-by-side boxplots of each type of plot. Do these boxplots support the results obtained in part (c)? Choose the correct answer below. O A. Yes, because the boxplots show that the means are not significantly different. No TiH B. Yes, because the boxplots show that at least one of the means is significantly different. OC. No, because the boxplots do not show that at least one of the means is significantly different. Spring Disk OD. No, because the boxplots show that all of the means are significantly different. Sludge Plot- 25 30 35 Number of Phants (e) Verify that the residuals are normally distributed. Probability Plot of Residuals The normal probability plot and linear correlation coefficient, r, is shown on the right. How does the normal probability plot of the residuals show that the residuals are normally distributed? O A. The plot is linear enough, because r is less than the critical value. OB. The plot is not linear enough, because r is greater than the critical value. 4.17 OC. The plot is linear enough, because r is greater than the critical value. Residuals OD. The plot is not linear enough, because r is less than the critical value. C0.984 O E. There is at least one outlier.
(c) Use the following one-way ANOVA table to test the hypothesis of equal means at the a0.05 level of significance. One-way ANOVA: Sludge Plot, Spring Disk, No Till Source DF 2 MS F 4.22 Factor 58.33 28.17 0.035 Error 15 100.17 6.68 Total 17 156.5 Should the null hypothesis be rejected? Ho; there is V evidence to conclude that the mean numbers of plants for each plot type are not equal. (d) Shown are side-by-side boxplots of each type of plot. Do these boxplots support the results obtained in part (c)? Choose the correct answer below. O A. Yes, because the boxplots show that the means are not significantly different. No TiH B. Yes, because the boxplots show that at least one of the means is significantly different. OC. No, because the boxplots do not show that at least one of the means is significantly different. Spring Disk OD. No, because the boxplots show that all of the means are significantly different. Sludge Plot- 25 30 35 Number of Phants (e) Verify that the residuals are normally distributed. Probability Plot of Residuals The normal probability plot and linear correlation coefficient, r, is shown on the right. How does the normal probability plot of the residuals show that the residuals are normally distributed? O A. The plot is linear enough, because r is less than the critical value. OB. The plot is not linear enough, because r is greater than the critical value. 4.17 OC. The plot is linear enough, because r is greater than the critical value. Residuals OD. The plot is not linear enough, because r is less than the critical value. C0.984 O E. There is at least one outlier.

MATLAB: An Introduction with Applications
6th Edition
ISBN:9781119256830
Author:Amos Gilat
Publisher:Amos Gilat
Chapter1: Starting With Matlab
Section: Chapter Questions
Problem 1P

Related questions
Question
1/ need help with c,d,e

Transcribed Image Text:The data in the accompanying table represent the number of com plants in randomly sampled rows (a 17-foot by 5-inch strip) for various types of plots. An agricultural researcher wants to know whether the mean numbers of plants for each plot type are equal. Complete
parts (a) through (e) below.
Click here to view the data table.
Click here to view the table of critical values for the correlation coefficient.
Table of critical values for the
correlation coefficient.
(a) Write the null and alternative hypotheses. Choose the correct answer below.
Sample Size, n Critical Value O
0.880
0.888
0.898
O A. Ha: at least one of the means is different and H,: Haludoe =Hspring "Pno till
6
O B. Ho: Hsludge "Hspring "Hno till and H: at least one of the means is different
8
0.906
0.912
0.918
O C. Ho: Hsludge " Hspring and H: the means are different
9.
Corn plants
10
11
O D. Ho: Hsludge "Hspring " Hno till and H: Hsludge Hspring Hno til
0.923
12
0.928
(b) Which of the following requirements must be satisfied to use the one-way ANOVA procedure? Select all that apply.
13
14
15
16
0.932
0.935
0.939
0.941
0.944
0.946
Sludge Plot Spring Disk
No Till
O A. The populations must be normally distributed.
O B. There must be k simple random samples, each from the same population, or k randomized experiments with a single treatment.
25
34
32
27
29
27
17
18
19
20
O C. The k samples must be independent of each other.
34
31
28
29
35
30
O D. There must be k simple random samples, one from each of k populations, or a randomized experiment with k treatments.
0.949
0.951
0.952
0.964
28
33
25
O E. The populations must have the same variance.
28
32
30
21
OF. The populations must have the same mean.
22
23
0.956
(c) Use the following one-way ANOVA table to test the hypothesis of equal means at the a= 0.05 level of significance.
0.957
24
25
0.959
One-way ANOVA: Sludge Plot, Spring Disk, No Till
Print
Done
Source
30
0.960
DF
2
15
MS
Factor
56.33
100.17
28.17
4.22
0.035
Error
6.68
Total
17
156.5
Should the null hypothesis be rejected?
Print
Done

Transcribed Image Text:(c) Use the following one-way ANOVA table to test the hypothesis of equal means at the a=0.05 level of significance.
One-way ANOVA: Sludge Plot, Spring Disk, No Till
Source
DF
2
MS
28.17
F
4.22
P
Factor
56.33
0.035
Error
15
100.17
6.68
Total
17
156.5
Should the null hypothesis be rejected?
Họ: there is
V evidence to conclude that the mean numbers of plants for each plot type are not equal.
(d) Shown are side-by-side boxplots of each type of plot. Do these boxplots support the results obtained in part (c)?
Choose the corect answer below.
O A. Yes, because the boxplots show that the means are not significantly different.
O B. Yes, because the boxplots show that at least one of the means is significantly different.
OC. No, because the boxplots do not show that at least one of the means is significantly different.
No TiH
Spring Disk
OD. No, because the boxplots show that all of the means are significantly different.
Sludge Plot-
25
30
Number of Plants
35
(e) Verify that the residuals are normally distributed.
Probability Plot of
Residuals
The normal probability plot and linear correlation coefficient, r, is shown on the right.
How does the normal probability plot of the residuals show that the residuals are normally distributed?
O A. The plot is linear enough, because r is less than the critical value.
OB. The plot is not linear enough, because r is greater than the critical value.
-4.17
OC. The plot is linear enough, because r is greater than the critical value.
Residuals
OD. The plot is not linear enough, because r is less than the critical value.
r=0.984
O E. There is at least one outlier.
Expert Solution
Step 1

Trending now
This is a popular solution!

Step by step
Solved in 2 steps with 1 images

Recommended textbooks for you
MATLAB: An Introduction with Applications
Statistics
ISBN:
9781119256830
Author:
Amos Gilat
Publisher:
John Wiley & Sons Inc

Probability and Statistics for Engineering and th…
Statistics
ISBN:
9781305251809
Author:
Jay L. Devore
Publisher:
Cengage Learning

Statistics for The Behavioral Sciences (MindTap C…
Statistics
ISBN:
9781305504912
Author:
Frederick J Gravetter, Larry B. Wallnau
Publisher:
Cengage Learning
MATLAB: An Introduction with Applications
Statistics
ISBN:
9781119256830
Author:
Amos Gilat
Publisher:
John Wiley & Sons Inc
Probability and Statistics for Engineering and th…
Statistics
ISBN:
9781305251809
Author:
Jay L. Devore
Publisher:
Cengage Learning
Statistics for The Behavioral Sciences (MindTap C…
Statistics
ISBN:
9781305504912
Author:
Frederick J Gravetter, Larry B. Wallnau
Publisher:
Cengage Learning

Elementary Statistics: Picturing the World (7th E…
Statistics
ISBN:
9780134683416
Author:
Ron Larson, Betsy Farber
Publisher:
PEARSON

The Basic Practice of Statistics
Statistics
ISBN:
9781319042578
Author:
David S. Moore, William I. Notz, Michael A. Fligner
Publisher:
W. H. Freeman

Introduction to the Practice of Statistics
Statistics
ISBN:
9781319013387
Author:
David S. Moore, George P. McCabe, Bruce A. Craig
Publisher:
W. H. Freeman