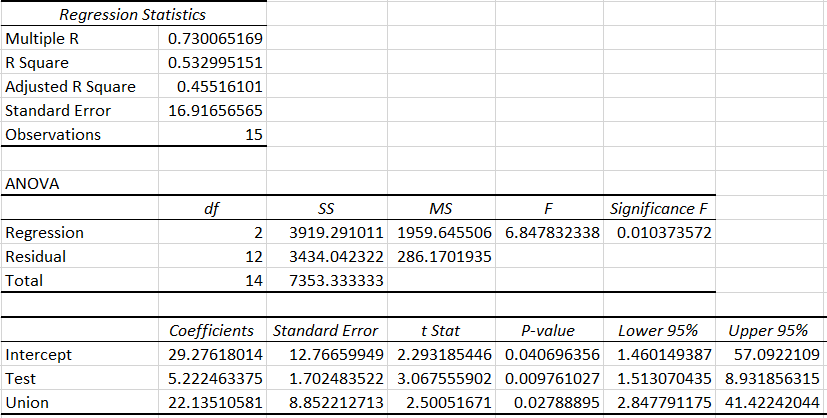
C-2. Compute the test statistic for union membership

MATLAB: An Introduction with Applications
6th Edition
ISBN:9781119256830
Author:Amos Gilat
Publisher:Amos Gilat
Chapter1: Starting With Matlab
Section: Chapter Questions
Problem 1P

Related questions
Question
C-2. Compute the test statistic for union membership

Transcribed Image Text:Gloss
Saved
Help
Save & Exit
Submit
Check my work
The manager of High Point Sofa and Chair, a large furniture manufacturer located in North Carolina, is studying the job performance
ratings of a sample of 15 electrical repairmen employed by the company. An aptitude test is required by the human resources
department to become an electrical repairman. The manager was able to get the score for each repairman in the sample. In addition,
he determined which of the repairmen were union members (code = 1) and which were not (code = 0). The sample information is
reported below.
%3D
Job Performance
Aptitude Test
Worker
Abbott
Union
Membership
Score
Score
58
Anderson
Bender
53
4.
33
10
Bush
97
10
Center
36
Coombs
Eckstine
83
7.
67
6.
Gloss
84
9.
0.
Herd
Householder
98
6.
1
45
1
Lori
Lindstrom
97
8.
90
6.
1
Mason
96
7.
1
Pierse
66
3
Rohde
82
6.
picture Click here for the Excel Data File.
a-1. Use a statistical software package to develop a multiple regression equation using the job performance score as the dependent
variable and aptitude test score and union membership as independent variables. (Round your answers to 3 decimal places.)
Performance =
Aptitude +
Union
< Prev
10 of 10
Next
MacBook Air

Transcribed Image Text:a-2. Complete the table. (Round your answers to 3 decimal places.)
Predictor
Coefficients
Standard Error
p-value
Constant
Aptitude
Union
a-3. Find the Standard error, R and R (adj). (Round your 'S'value to 4 decimal places and other answers to 1 decimal p
R2
%
R-Sq(adj)
a-4. Complete the ANOVA table. (Round your SS, MS, F, and P values to 2 decimal places.)
Analysis of Variance
Expert Solution
Working
Note :
We have used the excel data analysis tool to run the regression analysis.

Step by step
Solved in 2 steps with 1 images

Knowledge Booster


Learn more about
Need a deep-dive on the concept behind this application? Look no further. Learn more about this topic, statistics and related others by exploring similar questions and additional content below.Recommended textbooks for you
MATLAB: An Introduction with Applications
Statistics
ISBN:
9781119256830
Author:
Amos Gilat
Publisher:
John Wiley & Sons Inc

Probability and Statistics for Engineering and th…
Statistics
ISBN:
9781305251809
Author:
Jay L. Devore
Publisher:
Cengage Learning

Statistics for The Behavioral Sciences (MindTap C…
Statistics
ISBN:
9781305504912
Author:
Frederick J Gravetter, Larry B. Wallnau
Publisher:
Cengage Learning
MATLAB: An Introduction with Applications
Statistics
ISBN:
9781119256830
Author:
Amos Gilat
Publisher:
John Wiley & Sons Inc
Probability and Statistics for Engineering and th…
Statistics
ISBN:
9781305251809
Author:
Jay L. Devore
Publisher:
Cengage Learning
Statistics for The Behavioral Sciences (MindTap C…
Statistics
ISBN:
9781305504912
Author:
Frederick J Gravetter, Larry B. Wallnau
Publisher:
Cengage Learning

Elementary Statistics: Picturing the World (7th E…
Statistics
ISBN:
9780134683416
Author:
Ron Larson, Betsy Farber
Publisher:
PEARSON

The Basic Practice of Statistics
Statistics
ISBN:
9781319042578
Author:
David S. Moore, William I. Notz, Michael A. Fligner
Publisher:
W. H. Freeman

Introduction to the Practice of Statistics
Statistics
ISBN:
9781319013387
Author:
David S. Moore, George P. McCabe, Bruce A. Craig
Publisher:
W. H. Freeman