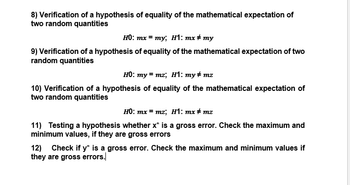
Based on the following values: Mathematical expectation: E(X) = ∑Xn1 = 1204 = 30 E(Y) = ∑Yn2 = 1884 = 47 E(Z) = ∑Zn3 = 1784 = 44.5 Variance: var(X) = 1n1-1∑X2-1n∑X2 = 14-13678-12024 =26 var(Y) = 1n2-1∑Y2-1n∑Y2 = 14-18890-18824 =18 var(Z) = 1n3-1∑Z2-1n3∑Z2 = 14-18322-17824 =133.6667 Root mean square deviation sd(X)= var(X) =26 = 5.0990 sd(Y)= var(Y) =18 = 4.2426 sd(Z)= var(Z) =133.6667 = 11.5614 Correlation coefficients X Y Z 25 44 28 28 43 48 37 49 55 30 52 47 1. Expectation 120 188 178 2. Variance 26 18 133.6667 3. root mean square deviation 5.099 4.2426 11.5614 Check the hypothesis in the image below. The table values are also there
Based on the following values:
Mathematical expectation:
E(X) = ∑Xn1 = 1204 = 30
E(Y) = ∑Yn2 = 1884 = 47
E(Z) = ∑Zn3 = 1784 = 44.5
Variance:
var(X) = 1n1-1∑X2-1n∑X2 = 14-13678-12024 =26
var(Y) = 1n2-1∑Y2-1n∑Y2 = 14-18890-18824 =18
var(Z) = 1n3-1∑Z2-1n3∑Z2 = 14-18322-17824 =133.6667
Root mean square deviation
sd(X)= var(X) =26 = 5.0990
sd(Y)= var(Y) =18 = 4.2426
sd(Z)= var(Z) =133.6667 = 11.5614
|
|
Y |
Z |
|
|
|
25 |
44 |
28 |
|
|
28 |
43 |
48 |
|
|
37 |
49 |
55 |
|
|
30 |
52 |
47 |
|
1. Expectation |
120 |
188 |
178 |
|
2. Variance |
26 |
18 |
133.6667 |
|
3. root mean square deviation |
5.099 |
4.2426 |
11.5614 |
Check the hypothesis in the image below. The table values are also there


Step by step
Solved in 3 steps with 6 images

I think this is great, thank you.
Could you please check the additional hypothesis in the image below


