Assume the random variable X is normally distributed with mean µ = 50 and standard deviation o = 7. Compute the probability. Be sure to draw a normal curve with the area corresponding to the probability shaded. P(57 SXS68) ..... Which of the following normal curves corresponds to P(57 sXs68)? OA. В. OC. Q 50 57 68 50 57 68 50 57 68
Assume the random variable X is normally distributed with mean µ = 50 and standard deviation o = 7. Compute the probability. Be sure to draw a normal curve with the area corresponding to the probability shaded. P(57 SXS68) ..... Which of the following normal curves corresponds to P(57 sXs68)? OA. В. OC. Q 50 57 68 50 57 68 50 57 68

MATLAB: An Introduction with Applications
6th Edition
ISBN:9781119256830
Author:Amos Gilat
Publisher:Amos Gilat
Chapter1: Starting With Matlab
Section: Chapter Questions
Problem 1P

Related questions
Question
![**Question:**
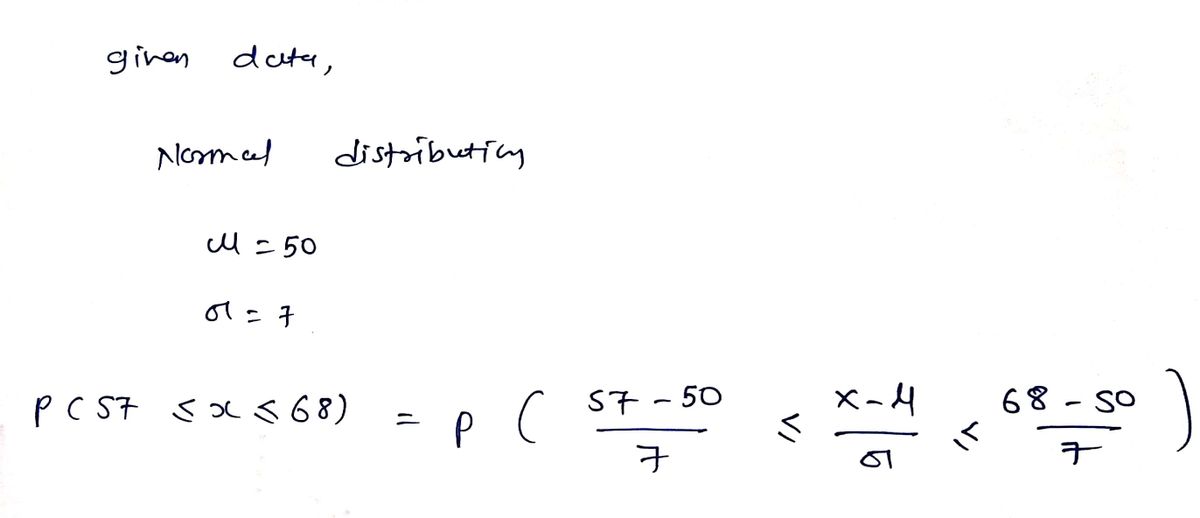
Assume the random variable \( X \) is normally distributed with mean \( \mu = 50 \) and standard deviation \( \sigma = 7 \). Compute the probability. Be sure to draw a normal curve with the area corresponding to the probability shaded.
\[ P(57 \leq X \leq 68) \]
---
Which of the following normal curves corresponds to \( P(57 \leq X \leq 68) \)?
**Options:**
**A.**
- The graph shows a normal curve with a shaded area between \( X = 57 \) and \( X = 68 \).
**B.**
- The graph shows a normal curve with a shaded area to the right of \( X = 57 \).
**C.**
- The graph shows a normal curve with a shaded area between \( X = 57 \) and \( X = 68 \). Similar to option A, it correctly represents the probability \( P(57 \leq X \leq 68) \).](/v2/_next/image?url=https%3A%2F%2Fcontent.bartleby.com%2Fqna-images%2Fquestion%2F7aa18df5-3501-4124-ae4e-4effb4109d7f%2Fe6275e38-4ab8-42a1-8891-ea97a5ddf578%2Fgnm6w4b_processed.png&w=3840&q=75)
Transcribed Image Text:**Question:**
Assume the random variable \( X \) is normally distributed with mean \( \mu = 50 \) and standard deviation \( \sigma = 7 \). Compute the probability. Be sure to draw a normal curve with the area corresponding to the probability shaded.
\[ P(57 \leq X \leq 68) \]
---
Which of the following normal curves corresponds to \( P(57 \leq X \leq 68) \)?
**Options:**
**A.**
- The graph shows a normal curve with a shaded area between \( X = 57 \) and \( X = 68 \).
**B.**
- The graph shows a normal curve with a shaded area to the right of \( X = 57 \).
**C.**
- The graph shows a normal curve with a shaded area between \( X = 57 \) and \( X = 68 \). Similar to option A, it correctly represents the probability \( P(57 \leq X \leq 68) \).
Expert Solution
Step 1

Step by step
Solved in 2 steps with 2 images

Recommended textbooks for you
MATLAB: An Introduction with Applications
Statistics
ISBN:
9781119256830
Author:
Amos Gilat
Publisher:
John Wiley & Sons Inc

Probability and Statistics for Engineering and th…
Statistics
ISBN:
9781305251809
Author:
Jay L. Devore
Publisher:
Cengage Learning

Statistics for The Behavioral Sciences (MindTap C…
Statistics
ISBN:
9781305504912
Author:
Frederick J Gravetter, Larry B. Wallnau
Publisher:
Cengage Learning
MATLAB: An Introduction with Applications
Statistics
ISBN:
9781119256830
Author:
Amos Gilat
Publisher:
John Wiley & Sons Inc
Probability and Statistics for Engineering and th…
Statistics
ISBN:
9781305251809
Author:
Jay L. Devore
Publisher:
Cengage Learning
Statistics for The Behavioral Sciences (MindTap C…
Statistics
ISBN:
9781305504912
Author:
Frederick J Gravetter, Larry B. Wallnau
Publisher:
Cengage Learning

Elementary Statistics: Picturing the World (7th E…
Statistics
ISBN:
9780134683416
Author:
Ron Larson, Betsy Farber
Publisher:
PEARSON

The Basic Practice of Statistics
Statistics
ISBN:
9781319042578
Author:
David S. Moore, William I. Notz, Michael A. Fligner
Publisher:
W. H. Freeman

Introduction to the Practice of Statistics
Statistics
ISBN:
9781319013387
Author:
David S. Moore, George P. McCabe, Bruce A. Craig
Publisher:
W. H. Freeman