Are couples that live together before they get married just as likely to end up divorced within five years of marriage compared to couples that live apart before


Are couples that live together before they get married just as likely to end up divorced within five years of marriage compared to couples that live apart before they get married? 268 of the 674 couples from the study who lived together before they got married were divorced within five years of marriage. 173 of the 405 couples from the study who lived apart before they got married were divorced within five years of marriage. What can be concluded at the = 0.05 level of significance?
For this study, we should use Select an answer z-test for a population proportion t-test for a population mean t-test for the difference between two independent population means z-test for the difference between two population proportions t-test for the difference between two dependent population means
- The null and alternative hypotheses would be:
Select an answer μ1 p1 Select an answer ≠ > < = Select an answer p2 μ2
Select an answer μ1 p1 Select an answer < = > ≠ Select an answer μ2 p2
- The test statistic ? z t = (please show your answer to 3 decimal places.)
- The p-value = (Please show your answer to 4 decimal places.)
- The p-value is ? > ≤
- Based on this, we should Select an answer reject accept fail to reject the null hypothesis.
- Thus, the final conclusion is that ...
- The results are statistically insignificant at αα = 0.05, so there is insufficient evidence to conclude the percent of all couples that live together before they get married who end up divorced within five years of marriage is not the same as the percent of all couples that live apart before they get married who end up divorced within five years of marriage.
- The results are statistically insignificant at αα = 0.05, so there is statistically significant evidence to conclude that the divorce rate for all couples that live together before they get married is equal to the divorce rate for all couples that live apart before they get married.
- The results are statistically significant at αα = 0.05, so there is sufficient evidence to conclude that the percent of the 674 couples that lived together before they got married who ended up divorced within five years of marriage is not the same as the percent of the 405 couples that lived apart before they got married who ended up divorced within five years of marriage.
- The results are statistically significant at αα = 0.05, so there is sufficient evidence to conclude that the percent of all couples that live together before they get married who end up divorced within five years of marriage is not the same as the percent of all couples that live apart before they get married who end up divorced within five years of marriage.
Let x1 denote the number of couples from the study who lived together before they got married were divorced within five years of marriage.
Let n1 denote the sample size of couples under study.
Here, x1= 268 and n1=674
Let x2 denote the number of couples from the study who lived apart before they got married were divorced within five years of marriage.
Let n2 denote the sample size under study.
Here x2=173 and n2= 405
The test used here is z-test for the difference between two population proportions.
The null and alternative hypotheses would be:
Ho:p1= p2
H1:p1≠ p2
The sample proportion of couples from the study who lived together before they got married were divorced within five years of marriage is,
1= ==0.3976
The sample proportion of couples from the study who lived apart before they got married were divorced within five years of marriage is,
2===0.4272
Compute the pooled proportion .
The pooled proportion is,
P=
=
=
=0.4087
1)
The test statistic is,
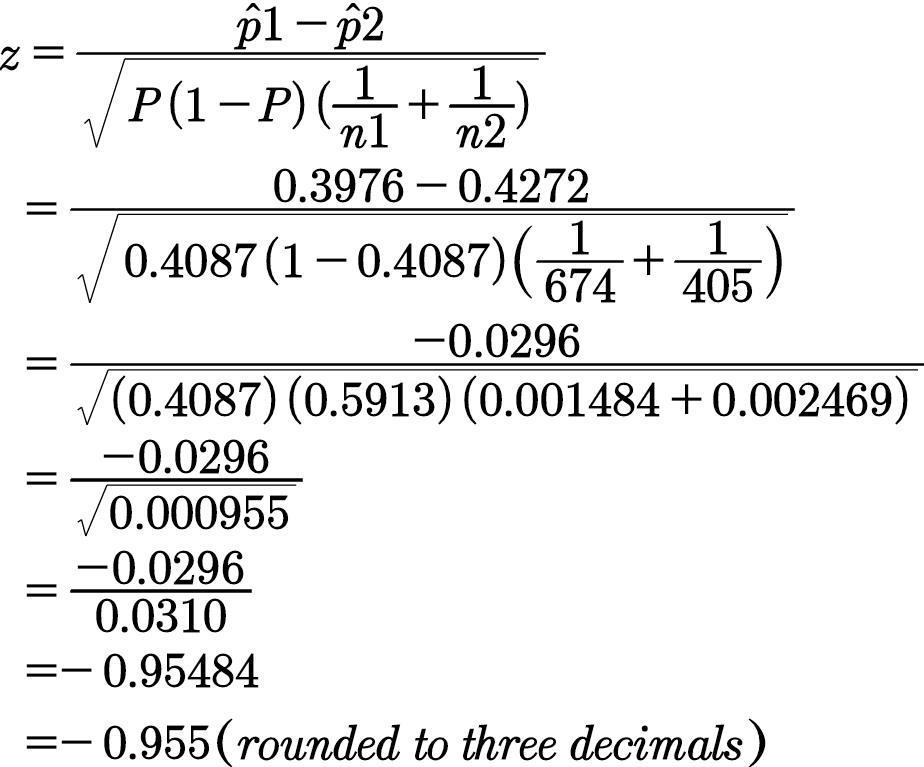

Step by step
Solved in 5 steps with 2 images


