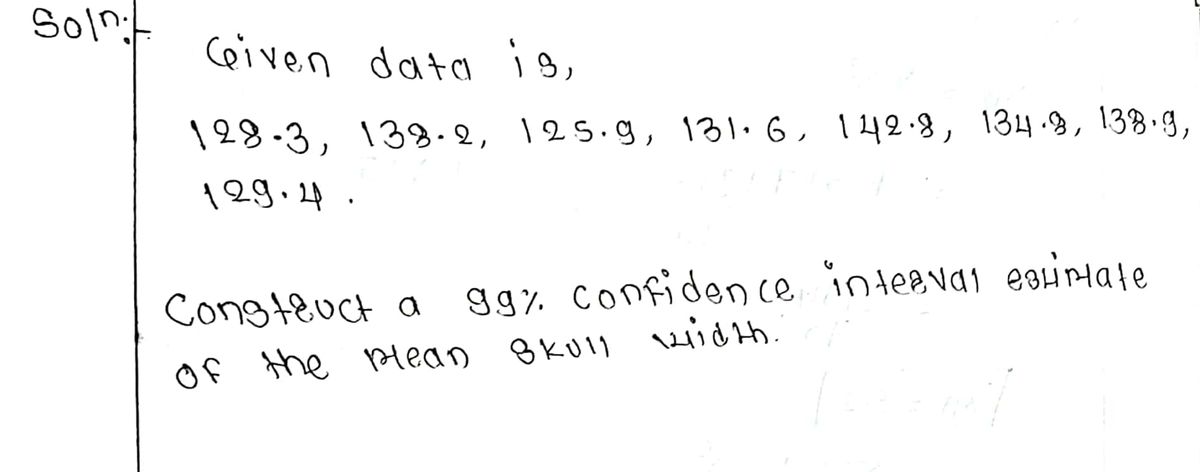
Archeologists have studied sizes of Egyptian skulls in an attempt to determine whether breeding occurred between different cultures. Listed below are the widths (mm) of skulls from 150 A.D. Construct a 99% confidence interval estimate of the mean skull width. 128.3 138.2 125.9 131.6 142.8 134.8 138.9 129.4 mm <μ< mm (Round to two decimal places as needed.)
Q: Suppose that textbook weights are normally distributed. You measure 36 textbooks' weights, and find…
A: Given, Sample size = 36 Sample mean = 76 Population standard deviation = 6.4 Since the…
Q: Researchers measured skulls from different time periods in an attempt to determine whether…
A: From given data we have : n x s 4000 B.C. n1=30 x1=131.46 s1=5.13 A.D. 150 n2 =30 x1=136.47…
Q: Archeologists have studied sizes of Egyptian skulls in an attempt to determine whether breeding…
A: The given data is as follows: 128.4137.9125.7132.3142.8135.3139.1128.6Confidence level,
Q: Use the Empirical Rule. The mean speed of a sample of vehicles along a stretch of highway is 69…
A: Solution:The empirical rule for any normal distribution is given below.68% of the observations fall…
Q: A sample of 20 part-time workers had mean annual earnings of $3120 with a standard deviation of…
A: As the population standard deviation is not known, we will use t distribution. df = n-1= 20-1=19…
Q: Maximum breadth of samples of male Egyptian skulls from 4000 B.C. and 150 A.D. (based on data from…
A:
Q: Find the sample size required to make to be 3 inches. 95% confidence interval estimate of the mean…
A:
Q: Suppose that textbook weights are normally distributed. You measure 45 textbooks' weights, and find…
A: The random variable X is the textbook weights It is normally distributed The sample size n=45 The…
Q: The average salary of 64 employee was 5400. Using historical data, we will assume that the…
A: Given,sample size(n)=64mean(X¯)=5400standard deviation(σ)=260α=1-0.95=0.05α2=0.025Z0.025=1.96…
Q: Archeologists have studied sizes of Egyptian skulls in an attempt to determine whether breeding…
A: Given,sample size(n)=8sample mean(x¯)=133.7375standard deviation(s)=5.82726degrees of…
Q: Construct a confidence interval for the mean of the paired differences for the two populations with…
A: Solution: From the given information, n=32, d-bar=1.358, α=0.05 and sd=0.635.
Q: The cross-tabulation data given below show the number of people who rated a customer service…
A: The given data is as follows: Friendliness/Politeness Staff GreetingNoYesNo 107Yes1318
Q: A group of students estimated the length of one minute without reference to a watch or clock, and…
A: Given that, Sample size n=15 Sample mean x¯=62.4 Sample standard deviation s=17.924
Q: The financial aid office wants to estimate the mean cost of textbooks per semester for students at a…
A: We have given that Margin of error =E = 15 Population standard deviation = 90 90% confidence…
Q: Construct a confidence interval for the mean of the paired differences for the two populations with…
A: Given, sample size (n) = 37 sample mean ( d̄ ) = 4.132 Standard deviation ( Sd ) = 0.749…
Q: Suppose that textbook weights are normally distributed. You measure 50 textbooks' weights, and find…
A:
Q: You want to estimate the mean fuel efficiency of a brand of automobiles with 99% confidence and a…
A:
Q: In the population of drivers, the mean number of traffic violations in the last 10 years is 5.2. In…
A: It is given that Population mean = 5.2 Sample mean = 4.25
Q: The daily number of accidents in a certain city is recorded for 36 days. The population standard…
A:
Q: SA study was conducted to determine the effect of ciaarette smoking on the carbon nonoxide diffusing…
A: The random variable diffusing capacity follows normal distribution. We have to construct 90%…
Q: Find the minimum sample size needed to construct 90% confidence interval for the population mean…
A: Standard deviation can find using range rule of thumb
Q: An engineer wishes to determine the width of a particular electronic component. If she knows that…
A: Given information, Standard deviation (σ) = 2.9 Error (E) = 0.4 To know how…
Q: The skidding distance of tractors along a new road were measured at 20 randomly selected road sites.…
A: Consider, Data 488 350 457 199 285 409 435 574 439 546 385 295 184…
Q: Two machines used for cutting steel are calibrated to cut exactly the same lengths. To test this…
A:
Q: A data set lists earthquake depths. The summary statistics are nequals=600600, x…
A:
Q: In a random sample of 39 criminals convicted of a certain crime, it was determined that the mean…
A: From the provided information, Sample size (n) = 39 Sample mean (x̅) = 53 Sample standard deviation…
Q: An advertising executive wants to estimate the mean weekly amount of time consumers spend watching…
A:
Q: Suppose that textbook weights are normally distributed. You measure 26 textbooks' weights, and find…
A:
Q: Based on this, construct a 99% confidence interval for the true population mean textbook weight
A: Sample size n = 42 Sample mean = 80 Population SD = 10.3 And the critical value of Z at 99%…
Q: Construct a 95% confidence interval for the population mean, μ. Assume the population has a…
A: Given Data : Sample Size, n = 20.0 Sample Mean, x̄ = 3120.0 standard…
Q: Exhibit 8.1. In order to estimate the average time spent on the computer terminals per student at…
A: Given information- Population standard deviation, σ = 1.2 hours Confidence interval = 0.95…
Q: Archeologists have studied sizes of Egyptian skulls in an attempt to determine whether breeding…
A: Given data is128.1,138.4,126.2,131.9,142.8,135.3,139.2,129.1 sample size(n)=8confidence level=99%
Q: A group of students estimated the length of one minute without reference to a watch or clock, and…
A:
Q: A sample of 169 observations showed an average of 15 and a standard deviation of 26. Construct the…
A: Since the population standard deviation is unknown, t distribution can be used for the computation…
Q: The annual earnings of 14 randomly selected computer software engineers have a sample standard…
A: Introduction: The 100 (1 – α) % confidence interval for the population variance, σ2, is the…
Q: A machine produces DVD discs. The diameters of these DVD discs vary, and the standard deviation is…
A: Given information: Standard deviation is 0.01 centimeter. Confidence level is 95% Significance level…
Q: Researchers measured skulls from different time periods in an attempt to determine whether…
A: The hypothesis that is to be tested is: H0:μBC=μADH1:μBC≠μAD The test statistic for the above…
Q: A study of 65 bolts of carpet showed that their average length was 78.2 yards. The standard…
A: Assume that confidence level is 99%. Here, sample size is 65. Sample mean = 78.2. Standard deviation…
Q: Suppose the method of tree ring dating gave the following dates A.D. for an archaeological…
A: From the provided information, Sample size (n) = 9 Confidence level = 98%
Q: Provide an appropriate response. A random sample of 40 students has a mean annual earnings of $3120…
A: Obtain the 94% confidence interval for the population mean. The 94% confidence interval for the…
Q: certain type was selected, and each was exposed to 100 pCi/L of radon. The resulting readings were…
A: 2.GivenSample size, The data is as follows:104.3, 89.6, 89.9, 95.6, 95.2, 90.0, 98.8, 103.7, 98.3,…
Q: Archeologists have studied sizes of Egyptian skulls in an attempt to determine whether breeding…
A: From the provided information,The data values are as follow:127.9 138.3 126.2 132.2 143.1 135.4…
Q: na random sample of 41 criminals convicted of a certain crime, it was determined that the mean…
A: Given that mean =62 ,s.d =11 ,n =41
Q: A random sample of 149 full-grown lobsters had a mean weight of 15 ounces. Assume that population…
A:
Q: Suppose that textbook weights are normally distributed. You measure 28 textbooks' weights, and find…
A: Givensample size(n)=28Mean(x)=73standard deviation(σ)=10.9confidence interval = 95%
Q: sample of eight math SAT scores is given below: 600530560700630640580680600530560700630640580680…
A: Eight scores given 600,530,560,700,630,640,580,680 First quartile (Q1) = (n+1)/4 th term Third…
Step by step
Solved in 3 steps with 3 images
- 300 high school students were asked how many hours.of TV they watch per day. The mean was 2 hours, with a standard deviation of .5. Using a 90% confidence level, calculate the maximum error of estimate A.7.43% B.0.27% C.5.66% D.4.75%When the population standard deviation is unknown and the sample size is greater than 30, what table value should be used in computing a confidence interval for a mean? a. z b. t c. chi square d. standard deviationPlease review Section 8.4. Answer all questions showing work for each, and rounding to the nearest integer. If the manager of a bottled water distributor wants to estimate, with 95% confidence, the mean amount of water in a 1-gallon bottle to within +0.003 gallons and also assumes that the standard deviation is 0.04 gallons, what sample size is needed? n = (Round up to the nearest integer.) TE light bult lieht
- Suppose that textbook weights are normally distributed. You measure 30 textbooks' weights, and find they have a mean weight of 65 ounces. Assume the population standard deviation is 11.6 ounces. Based on this, construct a 90% confidence interval for the true population mean textbook weight. Round answers to 2 decimal places.? ? ?In a random sample of ten people, the mean driving distance to work was 22.5 miles and the standard deviation was 5.6 miles. Assume the population is normally distributed and use the t-distribution to find the margin of error and construct a 90% confidence interval for the population mean u. Interpret the results. Identify the margin of error. (Rou e as needed.) Con square miles interval for the population mean. miles (Rou miles per hour e as needed.) Interpret the results. Select the correct choice below and fill in the answer box to complete your choice. (Type an integer or a decimal. Do not round.) OA. % of all random samples of ten people from the population will have a mean driving distance to work (in miles) that is between the interval's endpoints. B. With % confidence, it can be said that the population mean driving distance to work (in miles) is between the interval's endpoints. O C. It can be said that % of the population has a driving distance to work (in miles) that is…A group of students estimated the length of one minute without reference to a watch or clock, and the times (seconds) are listed below. Use a 0.01 significance level to test the claim that these times are from a population with a mean equal to 60 seconds. Does it appear that students are reasonably good at estimating one minute? 78 92 51 72 52 36 66 70 72 56 70 79 104 95 77 O A. Ho: H= 60 seconds O B. Ho: u= 60 seconds H1: µ> 60 seconds H1: µ< 60 seconds O C. Ho: H+ 60 seconds O D. Ho: µ = 60 seconds H1: µ= 60 seconds H1: µ+60 seconds Determine the test statistic (Round to two decimal places as needed.) Determine the P-value. (Round to three decimal places as needed.) State the final conclusion that addresses the original claim. V Họ. There is evidence to conclude that the original claim that the mean of the population of estimates is 60 seconds correct. It that, as a group, the students are reasonably good at estimating one minute. does not appear Click to select your answer(s).…
- Assume that a sample is used to estimate a population mean. Find the 90% confidence interval for a smaple of size 46 with a mean of 68.5 and a standard deviation of 6.6. Enter the answer as an open-interval (parentheses) accurate to one decimal place (because the sample statistics are reported accurate to one decimal place).You measure 39 textbooks' weights, and find they have a mean weight of 60 ounces. Assume the population standard deviation is 4.4 ounces. Based on this, construct a 90% confidence interval for the true population mean textbook weight.Give your answers as decimals, to three placesError = ? oz.Interval = ? oz. < μ < ? oz.A group of students estimated the length of one minute without reference to a watch or clock, and the times (seconds) are listed below. Use a 0.01 significance level to test the claim that these times are from a population with a mean equal to 60 seconds. Does it appear that students are reasonably good at estimating one minute? 75 88 48 77 50 33 69 72 78 59 73 82 100 101 75 D S Assuming all conditions for conducting a hypothesis test are met, what are the null and alternative hypotheses? O A. Ho: μ= 60 seconds OB. Ho: 60 seconds H₁ μ 60 seconds H₁: #60 seconds Determine the test statistic. lete (Round to two decimal places as needed.) Determine the P-value. (Round to three decimal places as needed.)
- The mean length of 25 newly hatched iguanas is 7.47 inches with a standard deviation of 0.77 inches. Assume that the lengths of all newly hatched iguanas are normally distributed. Step 2 of 2 : Construct a 98% confidence interval for the mean length of all newly hatched iguanas. Round your answer to two decimal places.With 98% confidence, we can say that the mean length of newly hatched iguanas is between _____________________.A researcher is studying how much electricity (in kilowatt hours) people from two different cities use in their homes. Random samples of 11 days from Tampa (Group 1) and 16 days from New York City (Group 2) are shown below. Test the claim that the mean number of kilowatt hours in Tampa greater than the mean number of kilowatt hours in New York City. Use a significance level of a = 0.10. Assume the populations are approximately normally distributed with unequal variances. Round answers to 4 decimal places. Tampa New York City 1015.4 1010 1010.3 1022.8 1001.7 1028.9 1001.7 1026.9 1022.6 1001.7 1020.2 1012.4 1021.9 1015.9 1018.9 1005.8 996.2 1006.1 1010.5 1012 1005.1 1025.9 1005.6 1020.2 985.3 994.9 1013.2 What are the correct hypotheses? Note this may view better in full screen mode. Select the correct symbols for each of the 6 spaces. Ho: Select an answer ✓ ? Select an answer ✓ H₁: Select an answer ✓ ? ✓ Select an answer ✓Researchers measured skulls from different time periods in an attempt to determine whether interbreeding of cultures occurred. Results are given below. Assume that both samples are independent simple random samples from populations having normal distributions. Use a 0.05 significance level to test the claim that the variation of maximal skull breadths in 4000 B.C. is the same as the variation in A.D. 150. n x 4000 B.C. 30 131.92 mm A.D. 150 30 136.92 mm 5.16 mm 5.31 mm What are the null and alternative hypotheses? Hoo #0₂ H₁:0₁ = 0₂ 2 2 OC H₂O²=0² H₁ <0 2 2 Identify the test statistic. F= (Round to two decimal places as needed.) B. H₂O=0₂ H₁0² #03 *D. Hollo² = 0² 2 2 2 H₁0₁20₂ 2