An article discussed the opening of a Market. The following data compared the prices of some kitchen staples at the new Market (group 1) and at the old Market (group 2) located 15 blocks away. ITEM GROUP 1 GROUP 2 HALF GALLON MILK 16.8 22.0 DOZEN EGGS 11.7 15.2 ORANGE JUICE (64OZ) 15.6 18.7 HEAD OF LETTUCE 16.7 15.6 1LB GROUND BEEF 17.5 20.8 6OZ TUNA 18.1 19.5 1LB APPLES 14.1 17.0 LINGUINI 21.8 19.5 SALMON STEAK 1LB 13.9 16.5 WHOLE CHICKEN PER LB 20.8 24.0 A. Use the math symbol to formulate null hypothesis and alternative hypothesis to test whether there is evidence that the mean price is lower at GROUP 1 than at GROUP 2. B. At the 0.01 level of significance, what is the value of the test statistic? What is the critical value? What is the degree of freedom? Using the critical value approach, is there evidence that the mean price is lower at GROUP 1 than at GROUP 2? What is your conclusion?
Inverse Normal Distribution
The method used for finding the corresponding z-critical value in a normal distribution using the known probability is said to be an inverse normal distribution. The inverse normal distribution is a continuous probability distribution with a family of two parameters.
Mean, Median, Mode
It is a descriptive summary of a data set. It can be defined by using some of the measures. The central tendencies do not provide information regarding individual data from the dataset. However, they give a summary of the data set. The central tendency or measure of central tendency is a central or typical value for a probability distribution.
Z-Scores
A z-score is a unit of measurement used in statistics to describe the position of a raw score in terms of its distance from the mean, measured with reference to standard deviation from the mean. Z-scores are useful in statistics because they allow comparison between two scores that belong to different normal distributions.
An article discussed the opening of a Market. The following data compared the prices of some kitchen staples at the new Market (group 1) and at the old Market (group 2) located 15 blocks away.
ITEM GROUP 1 GROUP 2
| HALF GALLON MILK | 16.8 | 22.0 |
| DOZEN EGGS | 11.7 | 15.2 |
| ORANGE JUICE (64OZ) | 15.6 | 18.7 |
| HEAD OF LETTUCE | 16.7 | 15.6 |
| 1LB GROUND BEEF | 17.5 | 20.8 |
| 6OZ TUNA | 18.1 | 19.5 |
| 1LB APPLES | 14.1 | 17.0 |
| LINGUINI | 21.8 | 19.5 |
| SALMON STEAK 1LB | 13.9 | 16.5 |
| WHOLE CHICKEN PER LB | 20.8 | 24.0 |
A. Use the math symbol to formulate null hypothesis and alternative hypothesis to test whether there is evidence that the
B. At the 0.01 level of significance, what is the value of the test statistic? What is the critical value? What is the degree of freedom? Using the critical value approach, is there evidence that the mean price is lower at GROUP 1 than at GROUP 2? What is your conclusion?
It is given that the prices of some kitchen staples at the new market and the old market.
Part A)
The claim is that the mean price is lower at GROUP 1 than at GROUP 2.
Hypotheses:
Null hypothesis: H0: µ1 – µ2 = 0.
Alternative hypothesis: H1: µ1 – µ2 < 0.
Therefore, the test is left-tailed.
Part B)
Given that the Level of significance is 0.01.
Calculations:
Calculate the mean and standard deviation for group 1 and group 2 using Excel is as follows:
Group 1:

Group 2:

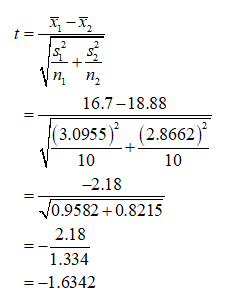
Test statistic:
Calculate the test statistic is as follows:

Therefore, the value of test statistic is –1.6342.
Step by step
Solved in 3 steps with 5 images


