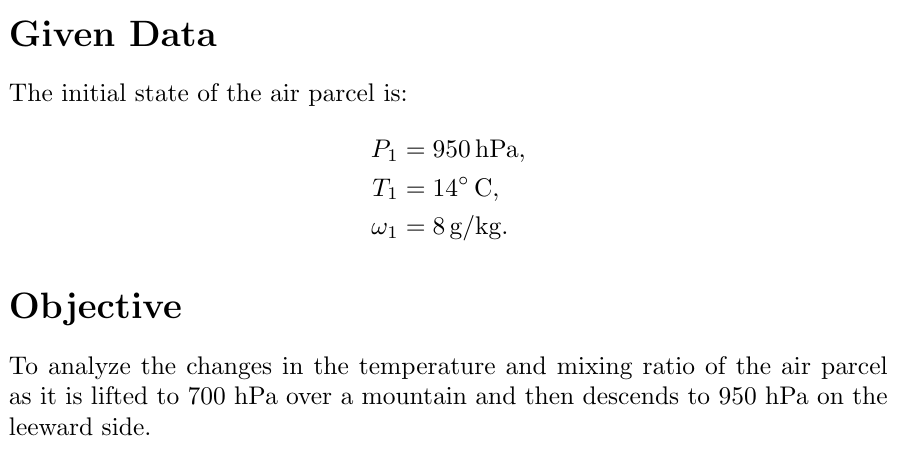
An air parcel at 950 mb has a temperature of 14°C and a mixing ratio of 8 g/kg. What is the wet-bulb potential temperature of the air? The air parcel is lifted to the 700 mb level by passing over a mountain, and 70% of the water vapor that is condensed out by the ascent is removed by precipitation. Determine the temperature, potential temperature, mixing ratio, and wet-bulb potential temperature of the air after it has returned to the 950 mb level on the other side of the mountain.
An air parcel at 950 mb has a temperature of 14°C and a mixing ratio of 8 g/kg. What is the wet-bulb potential temperature of the air? The air parcel is lifted to the 700 mb level by passing over a mountain, and 70% of the water vapor that is condensed out by the ascent is removed by precipitation. Determine the temperature, potential temperature, mixing ratio, and wet-bulb potential temperature of the air after it has returned to the 950 mb level on the other side of the mountain.

Elements Of Electromagnetics
7th Edition
ISBN:9780190698614
Author:Sadiku, Matthew N. O.
Publisher:Sadiku, Matthew N. O.
ChapterMA: Math Assessment
Section: Chapter Questions
Problem 1.1MA

Related questions

Question

Transcribed Image Text:2. An air parcel at 950 mb has a temperature of 14°C and a mixing ratio of 8 g/kg. What is the wet-bulb potential temperature of the air? The air parcel is lifted to the 700 mb level by passing over a mountain, and 70% of the water vapor that is condensed out by the ascent is removed by precipitation. Determine the temperature, potential temperature, mixing ratio, and wet-bulb potential temperature of the air after it has returned to the 950 mb level on the other side of the mountain.

Transcribed Image Text:The image shows a pseudo-adiabatic chart, used in meteorology to assess atmospheric conditions. The chart contains several key elements:
1. **Axes**:
- The vertical axis represents pressure in millibars (mb), ranging from 1000 mb to 100 mb in decreasing order.
- The horizontal axis represents temperature, denoted in both Celsius (°C) on the left and Kelvin (K) on the right.
2. **Isotherms**:
- Diagonal lines running from bottom-left to top-right represent constant temperature lines (isotherms). These are labeled with temperature values in degrees Celsius and Kelvin.
3. **Adiabats**:
- Curved dashed or solid lines represent dry adiabatic lapse rates, indicating temperature changes in a parcel of air that is lifted or descended without heat exchange.
4. **Moist Adiabats**:
- These are represented by less steeply curved lines compared to dry adiabats. They illustrate the temperature path of a saturated air parcel undergoing an adiabatic process.
5. **Saturation Mixing Ratio Lines**:
- Running nearly horizontally, these lines display the ratio of mass of water vapor to the mass of dry air, labeled in grams per kilogram (g/kg). They curve slightly, indicating changes in pressure.
6. **Wind Barbs and Features**:
- The chart may also include additional annotations or colored lines indicating specific atmospheric features or conditions, though they are not detailed here.
This chart is a crucial tool in weather forecasting, allowing meteorologists to interpret atmospheric stability and predict phenomena such as cloud formation and precipitation.
Expert Solution
Step 1: Given data

Step by step
Solved in 3 steps with 4 images

Knowledge Booster


Learn more about
Need a deep-dive on the concept behind this application? Look no further. Learn more about this topic, mechanical-engineering and related others by exploring similar questions and additional content below.Recommended textbooks for you
Elements Of Electromagnetics
Mechanical Engineering
ISBN:
9780190698614
Author:
Sadiku, Matthew N. O.
Publisher:
Oxford University Press

Mechanics of Materials (10th Edition)
Mechanical Engineering
ISBN:
9780134319650
Author:
Russell C. Hibbeler
Publisher:
PEARSON

Thermodynamics: An Engineering Approach
Mechanical Engineering
ISBN:
9781259822674
Author:
Yunus A. Cengel Dr., Michael A. Boles
Publisher:
McGraw-Hill Education
Elements Of Electromagnetics
Mechanical Engineering
ISBN:
9780190698614
Author:
Sadiku, Matthew N. O.
Publisher:
Oxford University Press
Mechanics of Materials (10th Edition)
Mechanical Engineering
ISBN:
9780134319650
Author:
Russell C. Hibbeler
Publisher:
PEARSON
Thermodynamics: An Engineering Approach
Mechanical Engineering
ISBN:
9781259822674
Author:
Yunus A. Cengel Dr., Michael A. Boles
Publisher:
McGraw-Hill Education

Control Systems Engineering
Mechanical Engineering
ISBN:
9781118170519
Author:
Norman S. Nise
Publisher:
WILEY

Mechanics of Materials (MindTap Course List)
Mechanical Engineering
ISBN:
9781337093347
Author:
Barry J. Goodno, James M. Gere
Publisher:
Cengage Learning

Engineering Mechanics: Statics
Mechanical Engineering
ISBN:
9781118807330
Author:
James L. Meriam, L. G. Kraige, J. N. Bolton
Publisher:
WILEY