A well-known multinational FMCG produces more than fifty products and sells them in the market. Out of fifty products one is mineral water for drinking purpose and supplies different size pack bottles in the market. Product manager observed that, during hot days the sale of water is more as compared to the normal days. He started the collection of data of weekly sale of water and the average weekly temperature. Product manager was interested in developing a relationship between sales and temperature; therefore, he discussed and shared the following data with you. sales 75 77 69 63 79 80 77 70 73 87 72 73 80 80 69 84 77 72 74 81 temperature 32 36 31 31 34 29 32 35 28 31 30 31 29 35 36 28 32 33 32 33 Sale is in thousand liters and temperature is in degree Celsius. Data is Nor
Correlation
Correlation defines a relationship between two independent variables. It tells the degree to which variables move in relation to each other. When two sets of data are related to each other, there is a correlation between them.
Linear Correlation
A correlation is used to determine the relationships between numerical and categorical variables. In other words, it is an indicator of how things are connected to one another. The correlation analysis is the study of how variables are related.
Regression Analysis
Regression analysis is a statistical method in which it estimates the relationship between a dependent variable and one or more independent variable. In simple terms dependent variable is called as outcome variable and independent variable is called as predictors. Regression analysis is one of the methods to find the trends in data. The independent variable used in Regression analysis is named Predictor variable. It offers data of an associated dependent variable regarding a particular outcome.
A well-known multinational FMCG produces more than fifty products and sells them in the market. Out of fifty products one is mineral water for drinking purpose and supplies different size pack bottles in the market. Product manager observed that, during hot days the sale of water is more as compared to the normal days. He started the collection of data of weekly sale of water and the average weekly temperature.
Product manager was interested in developing a relationship between sales and temperature; therefore, he discussed and shared the following data with you.
|
sales |
75 |
77 |
69 |
63 |
79 |
80 |
77 |
70 |
73 |
87 |
72 |
73 |
80 |
80 |
69 |
84 |
77 |
72 |
74 |
81 |
|
temperature |
32 |
36 |
31 |
31 |
34 |
29 |
32 |
35 |
28 |
31 |
30 |
31 |
29 |
35 |
36 |
28 |
32 |
33 |
32 |
33 |
Sale is in thousand liters and temperature is in degree Celsius. Data is
You are required to determine the following information for some concrete decision:
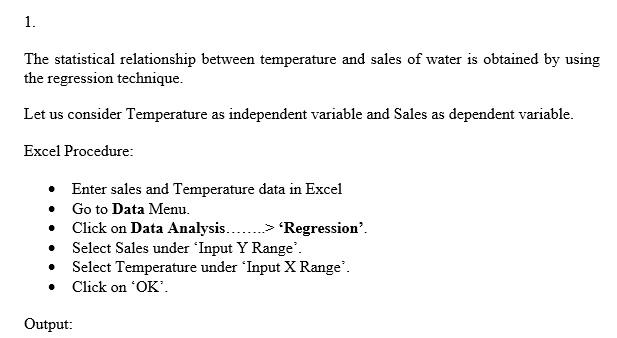
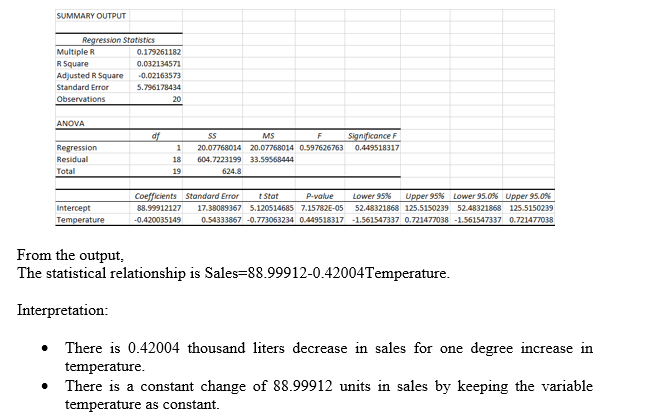
- Determine the statistical relationship between temperature and sale of water and interpret.
- How much change in sales if the temperature increases by two degrees?
- If for instance, the temperature becomes zero then how much sales will be?
- How much percent variation in sales due to temperature and due to other factors?
- Write the equation for the prediction of sales.
Hello! As you have posted more than 3 sub parts, we are answering the first 3 sub-parts. In case you require the unanswered parts also, kindly re-post that parts separately.


Step by step
Solved in 3 steps with 3 images


