A survey asked 100 stü to name the temperature at which they feel most comfortable. The box plot below shows the results for temperatures in infer degrees Fahrenheit. Which could you based on the box plot below? + + 50 55 60 65 70 75 80 85 90 95 100 + Most students prefer a temperature less than 65 degrees. B Most students prefer a temperature of at least 70 degrees. O Almost no students prefer a temperature of less than 75 degrees. O Almost no students prefer a temperature of more than 65 degrees.
A survey asked 100 stü to name the temperature at which they feel most comfortable. The box plot below shows the results for temperatures in infer degrees Fahrenheit. Which could you based on the box plot below? + + 50 55 60 65 70 75 80 85 90 95 100 + Most students prefer a temperature less than 65 degrees. B Most students prefer a temperature of at least 70 degrees. O Almost no students prefer a temperature of less than 75 degrees. O Almost no students prefer a temperature of more than 65 degrees.

MATLAB: An Introduction with Applications
6th Edition
ISBN:9781119256830
Author:Amos Gilat
Publisher:Amos Gilat
Chapter1: Starting With Matlab
Section: Chapter Questions
Problem 1P

Related questions
Question

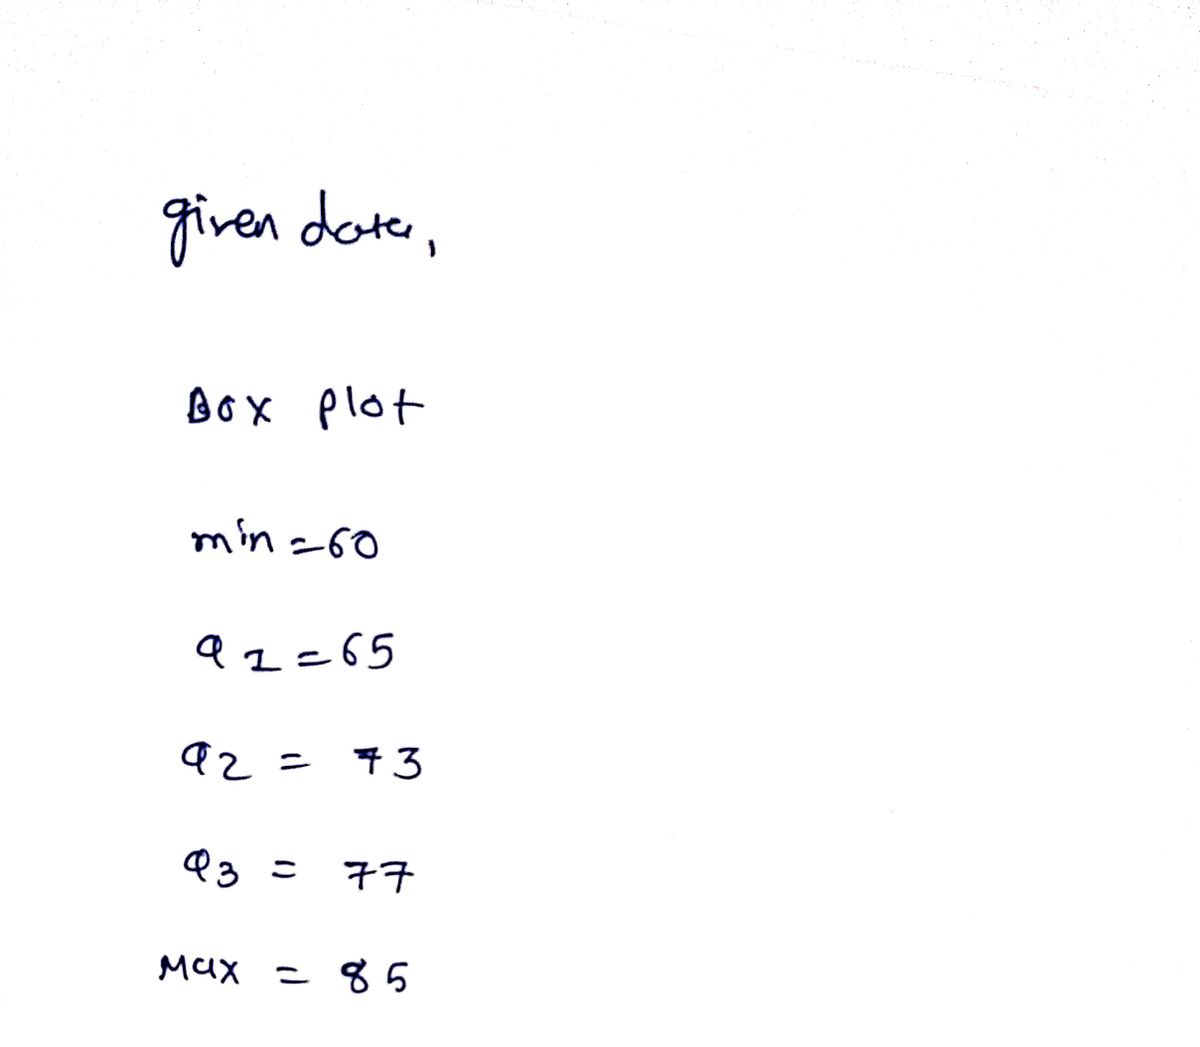
Transcribed Image Text:5. A survey asked 100 students in a school
to name the temperature at which they
feel most comfortable. The box plot below
shows the results for temperatures in
degrees Fahrenheit. Which could you infer
based on the box plot below?
+++ ++++ ++
50 55 60 65 70 75 80 85 90 95 100
A Most students prefer a temperature less
than 65 degrees.
B Most students prefer a temperature of
at least 70 degrees.
O Almost no students prefer a
temperature of less than 75 degrees.
D Almost no students prefer a
temperature of more than 65 degrees.
Expert Solution
Step 1

Trending now
This is a popular solution!

Step by step
Solved in 2 steps with 2 images

Recommended textbooks for you
MATLAB: An Introduction with Applications
Statistics
ISBN:
9781119256830
Author:
Amos Gilat
Publisher:
John Wiley & Sons Inc

Probability and Statistics for Engineering and th…
Statistics
ISBN:
9781305251809
Author:
Jay L. Devore
Publisher:
Cengage Learning

Statistics for The Behavioral Sciences (MindTap C…
Statistics
ISBN:
9781305504912
Author:
Frederick J Gravetter, Larry B. Wallnau
Publisher:
Cengage Learning
MATLAB: An Introduction with Applications
Statistics
ISBN:
9781119256830
Author:
Amos Gilat
Publisher:
John Wiley & Sons Inc
Probability and Statistics for Engineering and th…
Statistics
ISBN:
9781305251809
Author:
Jay L. Devore
Publisher:
Cengage Learning
Statistics for The Behavioral Sciences (MindTap C…
Statistics
ISBN:
9781305504912
Author:
Frederick J Gravetter, Larry B. Wallnau
Publisher:
Cengage Learning

Elementary Statistics: Picturing the World (7th E…
Statistics
ISBN:
9780134683416
Author:
Ron Larson, Betsy Farber
Publisher:
PEARSON

The Basic Practice of Statistics
Statistics
ISBN:
9781319042578
Author:
David S. Moore, William I. Notz, Michael A. Fligner
Publisher:
W. H. Freeman

Introduction to the Practice of Statistics
Statistics
ISBN:
9781319013387
Author:
David S. Moore, George P. McCabe, Bruce A. Craig
Publisher:
W. H. Freeman