A study was conducted to compare the yields of 4 varieties of corn (F, T, M, N). A plot of land was divided into 16 subplots (4 rows and 4 columns) The following Latin square design was run. Latitude Direction Longitude Direction Varieties of Cron Yield N E C 26.7 N EC A 19.7 N WC B 29 N W D 29.8 NC E A 23.1 NC EC B 21.7 NC WC D 24.9 NC W C 29 SC E B 29.3 SC EC D 20.1 SC WC C 29 SC W A 27.3 S E D 25.1 S EC C 17.4 S WC A 28.7 S W B 35.1
A study was conducted to compare the yields of 4 varieties of corn (F, T, M, N). A plot of land was divided into 16 subplots (4 rows and 4 columns) The following Latin square design was run.
| Latitude Direction | Longitude Direction | Varieties of Cron | Yield |
| N | E | C | 26.7 |
| N | EC | A | 19.7 |
| N | WC | B | 29 |
| N | W | D | 29.8 |
| NC | E | A | 23.1 |
| NC | EC | B | 21.7 |
| NC | WC | D | 24.9 |
| NC | W | C | 29 |
| SC | E | B | 29.3 |
| SC | EC | D | 20.1 |
| SC | WC | C | 29 |
| SC | W | A | 27.3 |
| S | E | D | 25.1 |
| S | EC | C | 17.4 |
| S | WC | A | 28.7 |
| S | W | B | 35.1 |
1) Does the different varieties of corn yield different yields? USE α= 0.05
2) Analyze the residuals from the experiment. Are all assumptions satisfied?
(1). Perform a Latin square design for the given data:
The data represents the yields of 4 varieties of corn for 4 latitudes and 4 longitudes.
MINITAB software can be used to perform Latin square design.
Software Procedure:
Step-by-step software procedure to perform a Latin square design using MINITAB software is as follows:
- Open an MINITAB sheet.
- Enter the data of Latin in column A and name it as Latin.
- Enter the data of Longitude in column A and name it as Longitude.
- Enter the data of Corn variety in column A and name it as Corn variety.
- Enter the data of Yield in column A and name it as Yield.
- In Responses enter
- In Factors enter Latitude, Longitude and
- In Graphs select Normal probability plot and Residual versus fit.
- Click OK.
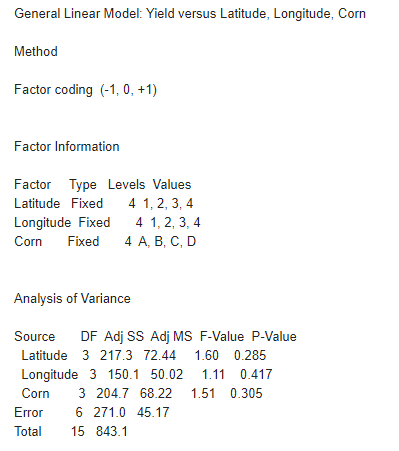
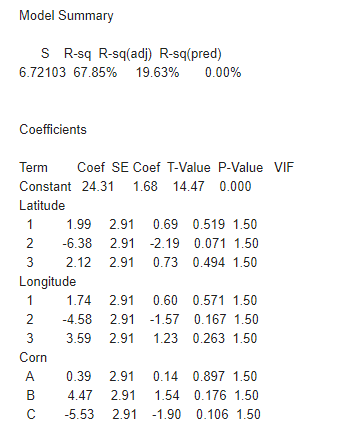
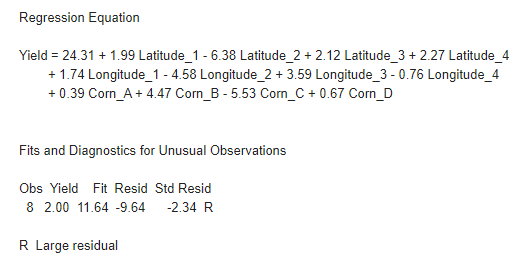
The output is shown below:


From the obtained output, the P-value corresponding to rows, columns and treatments are 0.285, 0.417 and 0.305.
Since, all the 3 P-values are greater than 0.05, it can be concluded that, the rows, columns and treatments are not significant.
Therefore, the different varieties of corn does not have different yields.
Step by step
Solved in 2 steps with 5 images


