A simple random sample of n1=12 measurements from a population with a population standard deviation σ1=5σ1=5 had a sample mean of x¯1=31. An independent simple random sample of n2=17 measurements from a different population with a population standard deviation σ2=3 had a sample mean of x¯2=30. Test the claim that the population means are different and use a level of significance of α=0.05. What is the level of significance? State the null and alternate hypotheses. H0:H0: Select an answer p μ1-μ2 p1-p2 μ μd Select an answer > = ≠ < H1:H1: Select an answer p μ μ1-μ2 p1-p2 μd Select an answer ≠ < > = Compute the sampling test statistic. (Round answer to two decimal places.) Find the P-value. (Round answer to four decimal places.)


A simple random sample of n1=12 measurements from a population with a population standard deviation σ1=5σ1=5 had a sample mean of x¯1=31. An independent simple random sample of n2=17 measurements from a different population with a population standard deviation σ2=3 had a sample mean of x¯2=30. Test the claim that the population means are different and use a level of significance of α=0.05.
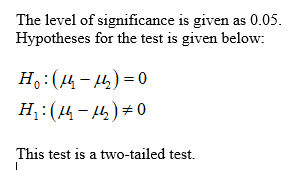
What is the level of significance?
State the null and alternate hypotheses.
H0:H0: Select an answer p μ1-μ2 p1-p2 μ μd Select an answer > = ≠ <
H1:H1: Select an answer p μ μ1-μ2 p1-p2 μd Select an answer ≠ < > =
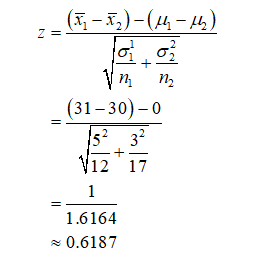
Compute the sampling test statistic. (Round answer to two decimal places.)
Find the P-value. (Round answer to four decimal places.)
Test statistic for t-test:
Since population standard deviations are known, the appropriate test is two sample z-test.
The test statistic for z-test is calculated as given below.

Step by step
Solved in 3 steps with 3 images


