A sample of n=9 athletes is taken from the SW population that has a M =29. Stress scores are measured for athletes. The scores are 23, 33, 26, 28, 30, 26, 27, 25, 25 SS=72 are the data sufficient to conclude that the treatment significantly decreased scores? Use one tailed test with a= .05 to see if we reject the null


A sample of n=9 athletes is taken from the SW population that has a M =29. Stress scores are measured for athletes. The scores are 23, 33, 26, 28, 30, 26, 27, 25, 25
SS=72
are the data sufficient to conclude that the treatment significantly decreased scores? Use one tailed test with a= .05 to see if we reject the null
State the hypotheses.

That is, there is no sufficient evidence to conclude that the treatment significantly decreased scores.

That is, there is sufficient evidence to conclude that the treatment significantly decreased scores.
Obtain the value of the test statistic.
The value of the test statistic is obtained below:
Use EXCEL Procedure for mean and standard deviation for the given samples.
Follow the instruction to obtain the values of mean and SD:
- Open EXCEL
- Go to Data>Data Analysis.
- Choose Descriptive Statistics.
- Enter the input range as $A$1:$A$10.
- Check the Labels in the first row.
- Check the option Summary statistics
- Click OK.
EXCEL output:
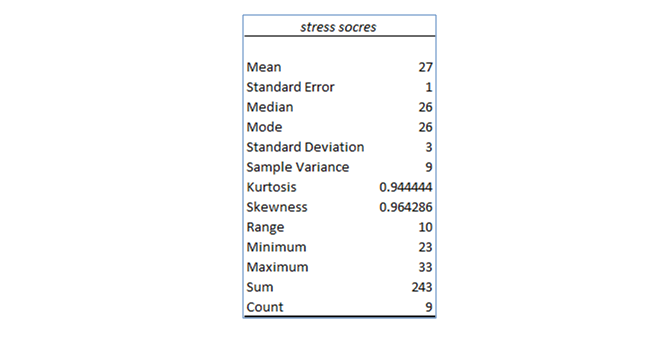
From the EXCEL output, the value of mean is 27 and the standard deviation is 3
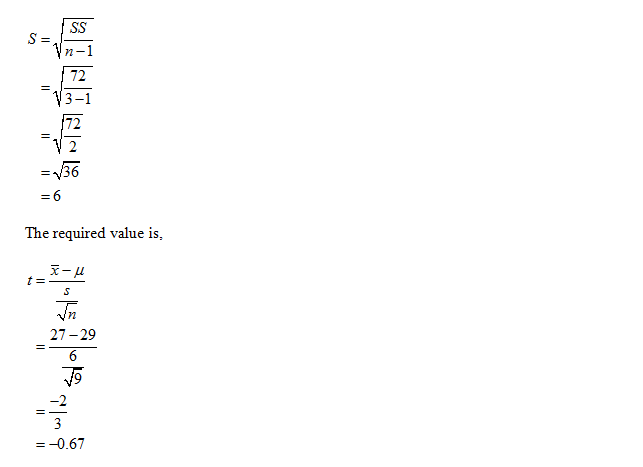
Thus, the value of the test statistic is –0.67

Step by step
Solved in 4 steps with 6 images


