A sample of 40 families with a child between the ages of 10 to 15 who have been diagnosed with high cholesterol participate in a study. Mean cholesterol is 175 with standard deviation of 19.5. Is there significant evidence 8f a reduction in cholesterol levels in the children? Run the appropriate test at the 5%level of significance and assume the null value for total cholesterol is 191.
A sample of 40 families with a child between the ages of 10 to 15 who have been diagnosed with high cholesterol participate in a study.
In this scenario, the aim is to test whether the mean cholesterol level in the children is less than 191.
Here, the sample size is greater than 30. So, it is appropriate to use one sample Z-test.
H0: μ = 191 versus Ha: μ <191
It is known that n= 40, x-bar=175, σ=19.5 and α = 0.05.
Rejection rule using p-value:
If p-value ≤ α, then reject null hypothesis.
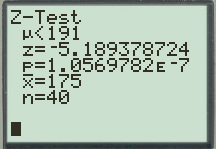
We are using graphing calculator (T1-83) to find the z-value and p-value.
Test statistic using T1-83:
- Press STAT>TESTS>Z-Test.
- Enter µ0 = 191, x-bar as 175, σ as 19.5, n as 40.
- Alternative: as “<µ0”.
- Select Calculate and press “Enter”.

Step by step
Solved in 2 steps with 1 images


