A researcher would like to predict the dependent variable YY from the two independent variables X1X1 and X2X2 for a sample of N=11N=11 subjects. Use multiple linear regression to calculate the coefficient of multiple determination and test statistics to assess the significance of the regression model and partial slopes. Use a significance level α=0.05α=0.05. X1X1 X2X2 YY 52.3 45.6 49.1 55.9 48.7 53.1 46.5 47.4 45.9 52 45.6 59.8 48.9 45.5 52.6 46.2 35.1 71.2 28.8 32.6 33.5 40.7 41 40.3 43.7 40 65.8 47 37.8 52.8 34.2 28 53.5
Correlation
Correlation defines a relationship between two independent variables. It tells the degree to which variables move in relation to each other. When two sets of data are related to each other, there is a correlation between them.
Linear Correlation
A correlation is used to determine the relationships between numerical and categorical variables. In other words, it is an indicator of how things are connected to one another. The correlation analysis is the study of how variables are related.
Regression Analysis
Regression analysis is a statistical method in which it estimates the relationship between a dependent variable and one or more independent variable. In simple terms dependent variable is called as outcome variable and independent variable is called as predictors. Regression analysis is one of the methods to find the trends in data. The independent variable used in Regression analysis is named Predictor variable. It offers data of an associated dependent variable regarding a particular outcome.
A researcher would like to predict the dependent variable YY from the two independent variables X1X1 and X2X2 for a sample of N=11N=11 subjects. Use multiple linear regression to calculate the coefficient of multiple determination and test statistics to assess the significance of the regression model and partial slopes. Use a significance level α=0.05α=0.05.
| X1X1 | X2X2 | YY |
|---|---|---|
| 52.3 | 45.6 | 49.1 |
| 55.9 | 48.7 | 53.1 |
| 46.5 | 47.4 | 45.9 |
| 52 | 45.6 | 59.8 |
| 48.9 | 45.5 | 52.6 |
| 46.2 | 35.1 | 71.2 |
| 28.8 | 32.6 | 33.5 |
| 40.7 | 41 | 40.3 |
| 43.7 | 40 | 65.8 |
| 47 | 37.8 | 52.8 |
| 34.2 | 28 | 53.5 |
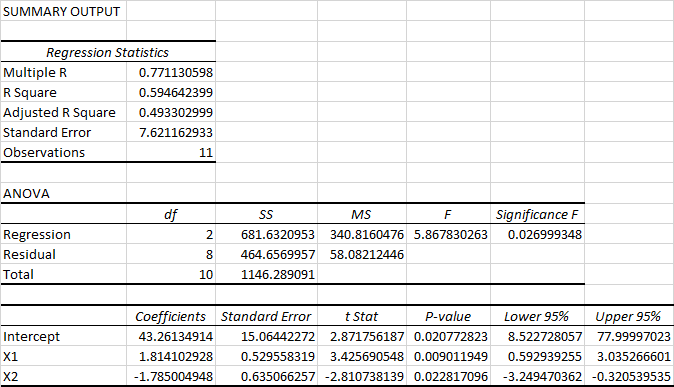
R2=R2= (Not the adjusted R2R2)
FF test statistic =
P-value for overall model =
test statistic for b1b1
p-value for the two-tailed test =
test statistic for b2b2
p-value for the two-tailed test =
What is your conclusion for the overall regression model at the 0.05 alpha level (also called the omnibus test)?
- The overall regression model is statistically significant at α=0.05α=0.05.
- The overall regression model is not statistically significant at α=0.05α=0.05.
Which of the regression coefficients are statistically different from zero at the 0.05 alpha level?
- neither regression coefficient is statistically significant
- the slope for the first variable b1b1 is the only statistically significant coefficient
- the slope for the second variable b2b2 is the only statistically significant coefficient
- both regression coefficients are statistically significant
Hello! As you have posted more than 3 sub parts, we are answering the first 3 sub-parts. In case you require the unanswered parts also, kindly re-post that parts separately.
Excel Procedure:
Enter X1, X2 and Y data in Excel>Data>Data Analysis> ‘Regression’>Select Y under ‘Input Y Range’>Select X1, X2 under ‘Input X Range’>Click on ‘OK’.
Output:

Step by step
Solved in 2 steps with 1 images


