A researcher wanted to determent mine if there was a significant difference in fat content between cookie dough and vanilla ice cream. So the researcher went to Safeway and recorded the fat in one serving (8 ounces) for all the brands of vanilla and cookie dough ice-cream. The results of their “research” is summarized in the following table. What statistical test should be performed to test the hypothesis? Perform the test and report the test statistic’s value and any other relevant information. With a 95% confidence level, are the results statistically significant? Cookie Dough (g) Vanilla (g) 13.5 12.9 14 12.5 13.6 11.5 12.9 10 13 10 9 11
A researcher wanted to determent mine if there was a significant difference in fat content between cookie dough and vanilla ice cream. So the researcher went to Safeway and recorded the fat in one serving (8 ounces) for all the brands of vanilla and cookie dough ice-cream. The results of their “research” is summarized in the following table.
- What statistical test should be performed to test the hypothesis?
- Perform the test and report the test statistic’s value and any other relevant information.
- With a 95% confidence level, are the results statistically significant?
|
Cookie Dough (g) |
Vanilla (g) |
|
13.5 |
12.9 |
|
14 |
12.5 |
|
13.6 |
11.5 |
|
12.9 |
10 |
|
13 |
10 |
|
|
9 |
|
|
11 |
The given data has 2 variables which are Cookie Dough and Vanilla.
Cookie Dough has 5 observations and Vanilla has 7 observations.
For this problem, we have test whether there is a significant difference in fat content between cookie dough and vanilla ice cream or not.
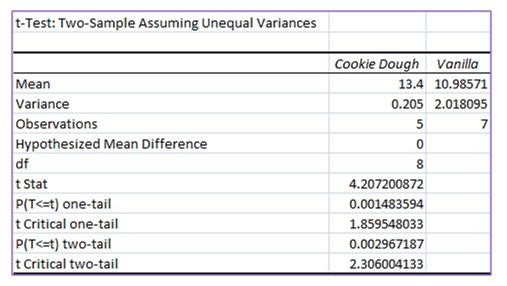
The test is two independent sample t-test. The test is two-tailed test.
Then we have to find the 95% confidence interval.
Null hypothesis:
There is no difference in fat content between cookie dough and vanilla ice cream.
Alternative hypothesis:
not equal to
There is a difference in fat content between cookie dough and vanilla ice cream.
EXCEL (Data Analysis) Procedure:
Step 1: In EXCEL sheet, enter Cookie Dough in one column and enter Vanilla in one column.
Step 2: In Data, select Data Analysis and choose t test: Two-Sample Assuming Unequal Variances.
Step 3: In Input Variable 1 Range: select Cookie Dough.
Step 4: In Input Variable 2 Range: select Vanilla.
Step 5: Select Lables. Click Ok.
EXCEL (Data Analysis) output:

Trending now
This is a popular solution!
Step by step
Solved in 4 steps with 2 images


