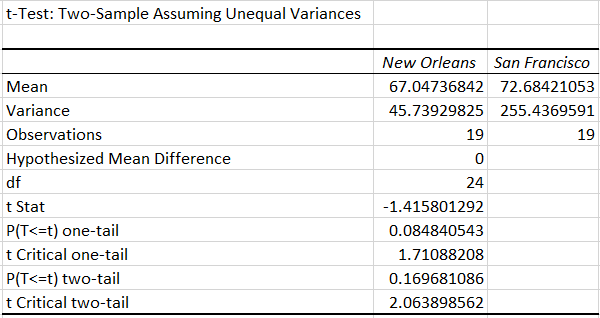
A researcher takes sample temperatures in Fahrenheit of 19 days from New Orleans (Group 1) and 19 days from San Francisco (Group 2). Test the claim that the mean temperature in New Orleans is less than the mean temperature in San Francisco. Use a significance level of α=0.05 . Assume the populations are approximately normally distributed with unequal variances. You obtain the following two samples of data. Round answers to 4 decimal places.
A researcher takes sample temperatures in Fahrenheit of 19 days from New Orleans (Group 1) and 19 days from San Francisco (Group 2). Test the claim that the
. Assume the populations are approximately
| New Orleans | San Francisco |
|---|---|
| 59.8 | 64.2 |
| 62.8 | 73.9 |
| 61.3 | 65.1 |
| 75.6 | 100.5 |
| 64.4 | 50.1 |
| 56.8 | 82.4 |
| 62.5 | 94.6 |
| 74.6 | 75.3 |
| 73.5 | 74.2 |
| 63.7 | 83.7 |
| 66.3 | 65.1 |
| 57.5 | 77.1 |
| 73.8 | 86.4 |
| 63.9 | 61.6 |
| 67.1 | 58.4 |
| 65.3 | 76 |
| 77.7 | 54 |
| 68.5 | 96.6 |
| 78.8 | 41.8 |
What are the correct hypotheses? Note this may view better in full screen
H0:
H1:
The correct decision is to .
The correct summary would be: the claim that the mean temperature in New Orleans is less than the mean temperature in San Francisco.
Note: We have used the excel data analysis tool to run the t-test.

Trending now
This is a popular solution!
Step by step
Solved in 2 steps with 1 images


