A research was conducted at University Y to test the IQ score of the studentbased on their brain dominance. The researcher selected a random sample of 10students with left-brain and a sample of 10 students with right-brain to test the IQ score. Without assuming the population is normally distributed, at a 5% significance level is there evidence that the left-brain dominance student scores more than right-brain dominance in the IQ test. The number of scores in the IQ test has been recorded as below

MATLAB: An Introduction with Applications
6th Edition
ISBN:9781119256830
Author:Amos Gilat
Publisher:Amos Gilat
Chapter1: Starting With Matlab
Section: Chapter Questions
Problem 1P
icon
Related questions
Question

A research was conducted at University Y to test the IQ score of the studentbased on their brain dominance. The researcher selected a random sample of 10students with left-brain and a sample of 10 students with right-brain to test the IQ score. Without assuming the population is normally distributed, at a 5% significance level is there evidence that the left-brain dominance student scores more than right-brain dominance in the IQ test. The number of scores in the IQ test has been recorded as below:

Left-brain Dominance
Right-brain Dominance
100
89
150
79
120
90
140
110
134
120
110
120
160
169
169
100
98
99
122
130
Transcribed Image Text:Left-brain Dominance Right-brain Dominance 100 89 150 79 120 90 140 110 134 120 110 120 160 169 169 100 98 99 122 130
Expert Solution
Step 1

Let X denotes the Left-brain Dominance

& Y denotes the Right-brain Dominance

To test whether the left-brain dominance student scores more than right-brain dominance in the IQ test. the hypothesis of interest is 

H0: μx=μyH1: μx>μy

Computation of test statistic and p-value:

  • Select STAT>TESTS>2-Samp T-Test.
  • Enter the appropriate values under "EDIT" option.
  • Select Calculate and press Enter.
  • Select µ1: >µ2 as alternative.
  • Under “Pooled”, select “Yes”.
  • Then press “Calculate”.

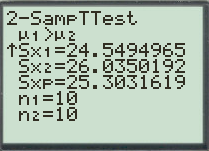
Output obtained using T1-84:
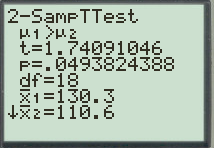
Statistics homework question answer, step 1, image 1Statistics homework question answer, step 1, image 2

steps

Step by step

Solved in 2 steps with 2 images

Blurred answer
Similar questions
  • SEE MORE QUESTIONS
Recommended textbooks for you
MATLAB: An Introduction with Applications
Statistics
ISBN:
9781119256830
Author:
Amos Gilat
Publisher:
John Wiley & Sons Inc
Probability and Statistics for Engineering and th…
Statistics
ISBN:
9781305251809
Author:
Jay L. Devore
Publisher:
Cengage Learning
Statistics for The Behavioral Sciences (MindTap C…
Statistics
ISBN:
9781305504912
Author:
Frederick J Gravetter, Larry B. Wallnau
Publisher:
Cengage Learning
Elementary Statistics: Picturing the World (7th E…
Statistics
ISBN:
9780134683416
Author:
Ron Larson, Betsy Farber
Publisher:
PEARSON
The Basic Practice of Statistics
Statistics
ISBN:
9781319042578
Author:
David S. Moore, William I. Notz, Michael A. Fligner
Publisher:
W. H. Freeman
Introduction to the Practice of Statistics
Statistics
ISBN:
9781319013387
Author:
David S. Moore, George P. McCabe, Bruce A. Craig
Publisher:
W. H. Freeman