A random sample of 9 subjects was asked to perform a given task. The time in seconds it took each of them to complete the task is recorded below. 25, 31, 36, 31, 43, 37, 30, 50, 31 Send data to calculator Send data to Excel If we assume that the completion times are normally distributed, find a 95% confidence interval for the true mean completion time for this task. Then find the lower limit and upper limit of the 95% confidence interval.
A random sample of 9 subjects was asked to perform a given task. The time in seconds it took each of them to complete the task is recorded below. 25, 31, 36, 31, 43, 37, 30, 50, 31 Send data to calculator Send data to Excel If we assume that the completion times are normally distributed, find a 95% confidence interval for the true mean completion time for this task. Then find the lower limit and upper limit of the 95% confidence interval.

MATLAB: An Introduction with Applications
6th Edition
ISBN:9781119256830
Author:Amos Gilat
Publisher:Amos Gilat
Chapter1: Starting With Matlab
Section: Chapter Questions
Problem 1P

Related questions
Topic Video
Question

Transcribed Image Text:A random sample of 9 subjects was asked to perform a given task. The time in seconds it took each of them to complete the task is recorded below.
25, 31, 36, 31, 43, 37, 30, 50, 31
Send data to Excel
Send data to calculator
If we assume that the completion times are normally distributed, find a 95% confidence interval for the true mean completion time for this task. Then
find the lower limit and upper limit of the 95% confidence interval.
Carry your intermediate computations to at least three decimal places. Round your answers to one decimal place. (If necessary, consult a list of
formulas.)
Lower limit: I
?
Upper limit:
Expert Solution
Step 1
Let denotes the true mean completion time for this task.
The descriptive analysis is conducted using EXCEL. The software procedure is given below:
- Enter the data.
- Select Data > Data Analysis >Descriptive Statistics> OK.
- Enter Input Range as Time column.
- Mark Labels in First Row.
- Mark Summary Statistics.
- Click OK.
The output using EXCEL is as follows:
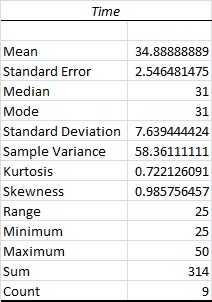
From the output, the mean is 34.8889, and the standard deviation is 7.6394.
The degrees of freedom is,
The degrees of freedom is 8.
Computation of critical value:
The critical value of t-distribution for 0.05 level of significance at 8 degrees of freedom can be obtained using the excel formula “=T.INV.2T(0.05,8)”. The critical value is 2.3060.

Trending now
This is a popular solution!

Step by step
Solved in 2 steps with 1 images

Knowledge Booster


Learn more about
Need a deep-dive on the concept behind this application? Look no further. Learn more about this topic, statistics and related others by exploring similar questions and additional content below.Recommended textbooks for you
MATLAB: An Introduction with Applications
Statistics
ISBN:
9781119256830
Author:
Amos Gilat
Publisher:
John Wiley & Sons Inc

Probability and Statistics for Engineering and th…
Statistics
ISBN:
9781305251809
Author:
Jay L. Devore
Publisher:
Cengage Learning

Statistics for The Behavioral Sciences (MindTap C…
Statistics
ISBN:
9781305504912
Author:
Frederick J Gravetter, Larry B. Wallnau
Publisher:
Cengage Learning
MATLAB: An Introduction with Applications
Statistics
ISBN:
9781119256830
Author:
Amos Gilat
Publisher:
John Wiley & Sons Inc
Probability and Statistics for Engineering and th…
Statistics
ISBN:
9781305251809
Author:
Jay L. Devore
Publisher:
Cengage Learning
Statistics for The Behavioral Sciences (MindTap C…
Statistics
ISBN:
9781305504912
Author:
Frederick J Gravetter, Larry B. Wallnau
Publisher:
Cengage Learning

Elementary Statistics: Picturing the World (7th E…
Statistics
ISBN:
9780134683416
Author:
Ron Larson, Betsy Farber
Publisher:
PEARSON

The Basic Practice of Statistics
Statistics
ISBN:
9781319042578
Author:
David S. Moore, William I. Notz, Michael A. Fligner
Publisher:
W. H. Freeman

Introduction to the Practice of Statistics
Statistics
ISBN:
9781319013387
Author:
David S. Moore, George P. McCabe, Bruce A. Craig
Publisher:
W. H. Freeman