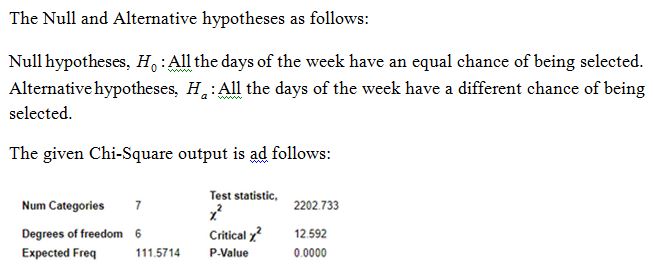
A random sample of 781 subjects was asked to identify the day of the week that is best for quality family time. Consider the claim that the days of the week are selected with a uniform distribution so that all days have the same chance of being selected. The table below shows goodness-of-fit test results from the claim and data from the study. Test that claim using either the critical value method or the P-value method with an assumed significance level of a = 0.05. Num Categories Degrees of freedom Expected Freq 7 6 111.5714 Test statistic, x² Critical x² P.Value 2202.733 12.592 0.0000
A random sample of 781 subjects was asked to identify the day of the week that is best for quality family time. Consider the claim that the days of the week are selected with a uniform distribution so that all days have the same chance of being selected. The table below shows goodness-of-fit test results from the claim and data from the study. Test that claim using either the critical value method or the P-value method with an assumed significance level of a = 0.05. Num Categories Degrees of freedom Expected Freq 7 6 111.5714 Test statistic, x² Critical x² P.Value 2202.733 12.592 0.0000

MATLAB: An Introduction with Applications
6th Edition
ISBN:9781119256830
Author:Amos Gilat
Publisher:Amos Gilat
Chapter1: Starting With Matlab
Section: Chapter Questions
Problem 1P

Related questions
Question

Transcribed Image Text:A random sample of 781 subjects was asked to identify the day of the week that is best for quality family time. Consider the claim that the days of the week are selected with a uniform distribution so that all days have the same chance of being selected. The table below shows
goodness-of-fit test results from the claim and data from the study. Test that claim using either the critical value method or the P-value method with an assumed significance level of α = 0.05.
Num Categories
Degrees of freedom
Expected Freq
Ho:
H₁:
Identify the test statistic.
x² =
7
6
111.5714
Determine the null and alternative hypotheses.
Ho. There
(Type an integer or a decimal.)
Identify the critical value.
x² = [ (Type an integer or a decimal.)
State the conclusion.
Test statistic,
₂²
Critical x²
P-Value
2202.733
12.592
0.0000
C
▼sufficient evidence to warrant rejection of the claim that the days of the week are selected with a uniform distribution. It
▼that all days have the same chance of being selected.

Transcribed Image Text:A random sample of 781 subjects was asked to identify the day of the week that is best for quality family time. Consider the claim that the days of the week are selected with a uniform distribution so that all days have the same chance of being selected. The table below shows
goodness-of-fit test results from the claim and data from the study. Test that claim using either the critical value method or the P-value method with an assumed significance level of α = 0.05.
Ho:
H₁:
Iden
Num Categories
Degrees of freedom
Expected Freq
Iden
x² =
Determine the null and alternative hypotheses.
7
6
111.5714
State
Test statistic,
x²
Critical ²
P-Value
2202.733
12.592
0.0000
At least one day of the week has a different chance of being selected.
At least two days of the week have a different frequency of being selected.
All days of the week have a different chance of being selected.
All days of the week have an equal chance of being selected.
C
he days of the week are selected with a uniform distribution. It
▼that all days have the same chance of being selected.
Expert Solution
Step 1

Step by step
Solved in 2 steps with 2 images

Recommended textbooks for you
MATLAB: An Introduction with Applications
Statistics
ISBN:
9781119256830
Author:
Amos Gilat
Publisher:
John Wiley & Sons Inc

Probability and Statistics for Engineering and th…
Statistics
ISBN:
9781305251809
Author:
Jay L. Devore
Publisher:
Cengage Learning

Statistics for The Behavioral Sciences (MindTap C…
Statistics
ISBN:
9781305504912
Author:
Frederick J Gravetter, Larry B. Wallnau
Publisher:
Cengage Learning
MATLAB: An Introduction with Applications
Statistics
ISBN:
9781119256830
Author:
Amos Gilat
Publisher:
John Wiley & Sons Inc
Probability and Statistics for Engineering and th…
Statistics
ISBN:
9781305251809
Author:
Jay L. Devore
Publisher:
Cengage Learning
Statistics for The Behavioral Sciences (MindTap C…
Statistics
ISBN:
9781305504912
Author:
Frederick J Gravetter, Larry B. Wallnau
Publisher:
Cengage Learning

Elementary Statistics: Picturing the World (7th E…
Statistics
ISBN:
9780134683416
Author:
Ron Larson, Betsy Farber
Publisher:
PEARSON

The Basic Practice of Statistics
Statistics
ISBN:
9781319042578
Author:
David S. Moore, William I. Notz, Michael A. Fligner
Publisher:
W. H. Freeman

Introduction to the Practice of Statistics
Statistics
ISBN:
9781319013387
Author:
David S. Moore, George P. McCabe, Bruce A. Craig
Publisher:
W. H. Freeman