A marketing professor at Givens College is int course last quarter follow.


Unitary Method
The word “unitary” comes from the word “unit”, which means a single and complete entity. In this method, we find the value of a unit product from the given number of products, and then we solve for the other number of products.
Speed, Time, and Distance
Imagine you and 3 of your friends are planning to go to the playground at 6 in the evening. Your house is one mile away from the playground and one of your friends named Jim must start at 5 pm to reach the playground by walk. The other two friends are 3 miles away.
Profit and Loss
The amount earned or lost on the sale of one or more items is referred to as the profit or loss on that item.
Units and Measurements
Measurements and comparisons are the foundation of science and engineering. We, therefore, need rules that tell us how things are measured and compared. For these measurements and comparisons, we perform certain experiments, and we will need the experiments to set up the devices.
The second slide is the first part of the question and the first slide is the second part of the question


Note:
Hi there! Thank you for posting the question. As your question has more than 3 parts, we have solved only the first three subparts for you. If you need any specific subpart to be answered, please re-submit the question by specifying the subpart number or name.
(a). Develop an estimated regression equation showing how total points earned can be predicted from hours spend studying:
Simple linear regression model:
A simple linear regression model is given as y^ = b0 + bx + e where y^ is the predicted value of response variable, and x be the predictor variable. The quantity b is the estimated slope corresponding to x and b0 is the estimated intercept of the line, from the sample data.
Given data represents the values of the variables x = Hours spent studying and y = Total points earned for a sample of 10 students.
EXCEL software can be used to obtain the simple regression equation.
Software Procedure:
Step-by-step software procedure to perform a simple linear regression model using EXCEL software is as follows:
- Open an EXCEL file.
- Enter the data of Total points earned in columns A and name it as Total points earned.
- Enter the data of Hours spent studying in column B and name them as Hours spent studying.
- Go to Data > Data Analysis > Regression.
- Enter Input Y Range as $A$1:$A$11, enter Input X Range as $B$1:$B$11.
- Select Labels, Confidence Level and enter the confidence level as 95%.
- Click OK.
The output is:
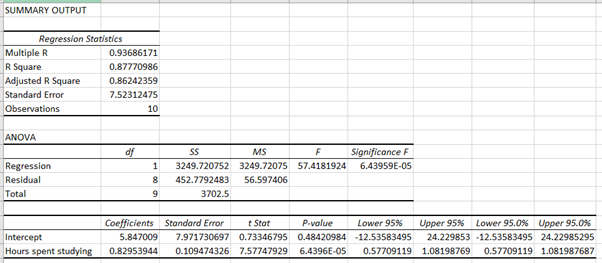
From the obtained regression output, the estimated slope corresponding to the predictor variable “X = Hours spent studying” is b = 0.83 and the estimated intercept of the line is b0 = 5.85.
The estimated regression equation showing how total points earned can be predicted from hours spend studying is Total points earned = 5.85 + 0.83*Hours spent studying.
Thus, the regression equation is Y^ = 5.85 + 0.83*X.

Step by step
Solved in 4 steps with 2 images


