(a) Make a scatter diagram of the data. Then visualize the line you think best fits the data. (b) Would you say the correlation is low, moderate, or strong? Would you say the correlation is positive or negative? (c) Use a calculator to verify that Ex = 5817, x² = 5,645,271, y = 553, y2 = 59,835 and %3D Exy = 529,301.
(a) Make a scatter diagram of the data. Then visualize the line you think best fits the data. (b) Would you say the correlation is low, moderate, or strong? Would you say the correlation is positive or negative? (c) Use a calculator to verify that Ex = 5817, x² = 5,645,271, y = 553, y2 = 59,835 and %3D Exy = 529,301.

MATLAB: An Introduction with Applications
6th Edition
ISBN:9781119256830
Author:Amos Gilat
Publisher:Amos Gilat
Chapter1: Starting With Matlab
Section: Chapter Questions
Problem 1P

Related questions

Question
2) Statistics

Transcribed Image Text:Tutorial Exercise
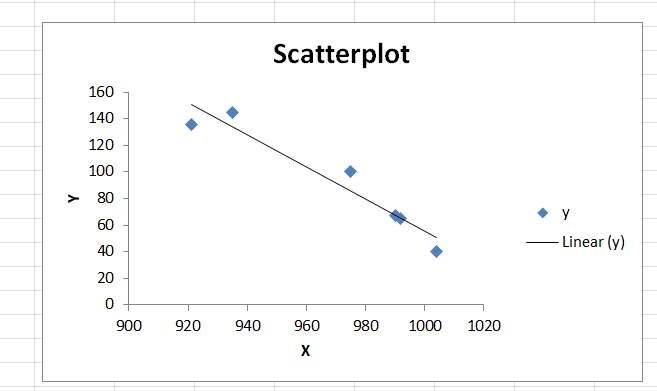
Can a low barometer reading be used to predict maximum wind
speed of an approaching tropical cyclone? For a random sample
of tropical cyclones, let x be the lowest pressure (in millibars) as
a cyclone approaches, and let y be the maximum wind speed (in
miles per hour) of the cyclone.
1004
975
992
935
990
921
y
40
100
65
145
67
136
(a) Make a scatter diagram of the data. Then visualize the
line you think best fits the data.
(b) Would you say the correlation is low, moderate, or
strong?
Would you say the correlation is positive or negative?
(c) Use a calculator to verify that
Ex = 5817, Ex² = 5,645,271, y = 553, y2 = 59,835 and
xy = 529,301.
Compute r.
As x increases, does the value of r imply that y should tend
to increase or decrease? Explain your answer.

Transcribed Image Text:Look at the following diagrams. Which diagrams show high linear correlation,
moderate or low linear correlation, or no linear correlation?
(a)
(b)
(c)
(a)
--Select---
(b)
--Select---
--Select---
Expert Solution
Step 1` (a)
The scatter plot can be drawn as:

Trending now
This is a popular solution!

Step by step
Solved in 3 steps with 2 images

Knowledge Booster


Learn more about
Need a deep-dive on the concept behind this application? Look no further. Learn more about this topic, statistics and related others by exploring similar questions and additional content below.Recommended textbooks for you
MATLAB: An Introduction with Applications
Statistics
ISBN:
9781119256830
Author:
Amos Gilat
Publisher:
John Wiley & Sons Inc

Probability and Statistics for Engineering and th…
Statistics
ISBN:
9781305251809
Author:
Jay L. Devore
Publisher:
Cengage Learning

Statistics for The Behavioral Sciences (MindTap C…
Statistics
ISBN:
9781305504912
Author:
Frederick J Gravetter, Larry B. Wallnau
Publisher:
Cengage Learning
MATLAB: An Introduction with Applications
Statistics
ISBN:
9781119256830
Author:
Amos Gilat
Publisher:
John Wiley & Sons Inc
Probability and Statistics for Engineering and th…
Statistics
ISBN:
9781305251809
Author:
Jay L. Devore
Publisher:
Cengage Learning
Statistics for The Behavioral Sciences (MindTap C…
Statistics
ISBN:
9781305504912
Author:
Frederick J Gravetter, Larry B. Wallnau
Publisher:
Cengage Learning

Elementary Statistics: Picturing the World (7th E…
Statistics
ISBN:
9780134683416
Author:
Ron Larson, Betsy Farber
Publisher:
PEARSON

The Basic Practice of Statistics
Statistics
ISBN:
9781319042578
Author:
David S. Moore, William I. Notz, Michael A. Fligner
Publisher:
W. H. Freeman

Introduction to the Practice of Statistics
Statistics
ISBN:
9781319013387
Author:
David S. Moore, George P. McCabe, Bruce A. Craig
Publisher:
W. H. Freeman