A low-level CDC bureaucrat wants to please his boss by gathering evidence that the current government-mandated shutdown of society is not causing people’s mental health to deteriorate, so that it can safely be continued for several years if any expert says it’s necessary. He polls a random sample of 1600 citizens, gathering data on such items as income loss, weight gain, access to toilet paper, hours spent binge-watching Netflix, and number of injuries caused by household fights, and compiles all this into a scientifically-weighted “misery index”. The mean misery index from the sample is 99.2; it seems reasonable to use a population standard deviation σ = 19.1. a) Does this information provide significant evidence (at the 5% level) that the nationwide mean misery index is less than 100? Set up appropriate null and alternative hypotheses, calculate the appropriate test statistic, find the P-value, and state your conclusion. b) A CDC press release publishing the results of this study claims that “Americans are fine and can hold out for years”. Comment on how the use of statistics supports the credibility of this claim.


A low-level CDC bureaucrat wants to please his boss by gathering evidence that
the current government-mandated shutdown of society is not causing people’s mental
health to deteriorate, so that it can safely be continued for several years if any
expert says it’s necessary.
He polls a random sample of 1600 citizens, gathering data on such items as
income loss, weight gain, access to toilet paper, hours spent binge-watching
Netflix, and number of injuries caused by household fights, and compiles all this
into a scientifically-weighted “misery index”.
The mean misery index from the sample is 99.2; it seems reasonable to use a
population standard deviation σ = 19.1.
a) Does this information provide significant evidence (at the 5% level) that the
nationwide mean misery index is less than 100? Set up appropriate null and
alternative hypotheses, calculate the appropriate test statistic, find the P-value,
and state your conclusion.
b) A CDC press release publishing the results of this study claims that “Americans
are fine and can hold out for years”. Comment on how the use of statistics supports
the credibility of this claim.
A low-level CDC bureaucrat wants to please his boss by gathering evidence that the current government-mandated shutdown of society is not causing people’s mental health to deteriorate, so that it can safely be continued for several years if any expert says it’s necessary.
He polls a random sample of 1600 citizens, gathering data on such items as income loss, weight gain, access to toilet paper, hours spent binge-watching Netflix, and number of injuries caused by household fights, and compiles all this into a scientifically-weighted “misery index”.
The mean misery index from the sample is 99.2; it seems reasonable to use a population standard deviation 19.1. This gives, sample size (n) = 1600, sample mean () = 99.2, population standard deviation (σ) = 19.1.
We need to test whether the information provide significant evidence (at the 5% level) that the nationwide mean misery index is less than 100.
To test the claim about population mean, we use either the Z test or t test. If the population standard deviation is known and sample size is sufficiently large then we use Z test otherwise we use t test.
Here in this example, we know the population standard deviation (σ) also the sample size is sufficiently large hence we use one sample Z test.
The null and alternative hypotheses in this case can be stated as follows;
H0 : µ1 = µ2 Vs H1 : µ1 < µ2
Since the alternative hypothesis (H1) contains "<" sign the test is left tailed test.
The formula for test statistic and degrees of freedom in this case are as follow,
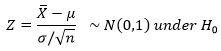
Here in the example, we have the sample size (n) = 1600, sample mean () = 99.2, population standard deviation (σ) = 19.1. Plugging these values in the formula given above we get,
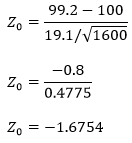
The p-value in this context is given by, P( Z < Z0)=P(Z < -1.6754). This can be found using the excel command, "NORMSDIST(z)". Hence we get, p-value = 0.04693.

Trending now
This is a popular solution!

Step by step
Solved in 3 steps with 2 images


