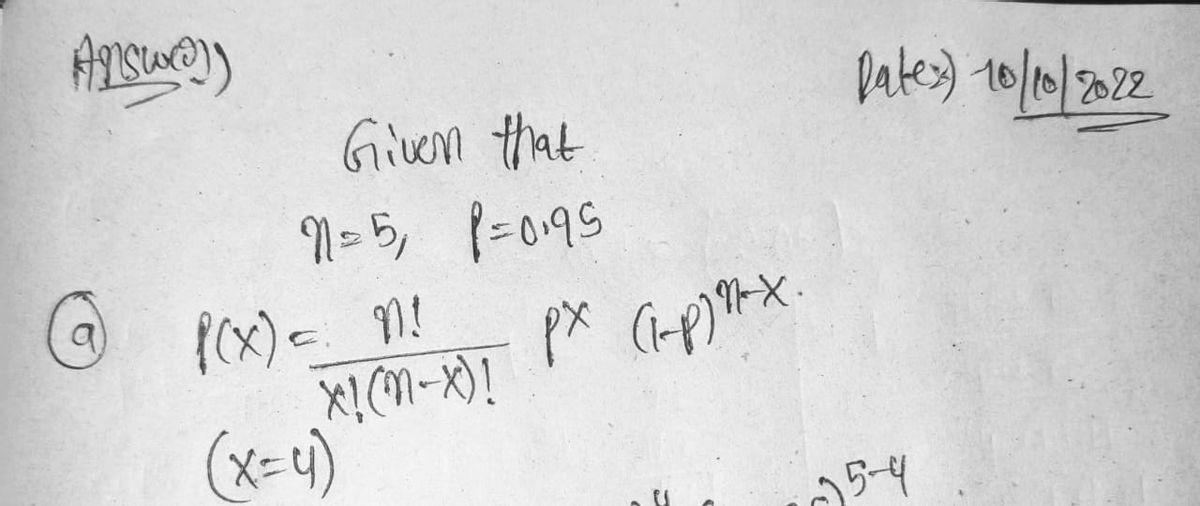
A hotel claims that 95% of its customers are very satisfied with its service. Complete parts a through d below based on a random sample of five customers. a. What is the probability that exactly four customers are very satisfied? (Round to four decimal places as needed.)
Q: The director of student services at San Bernardino Valley College is interested in whether women are…
A: Given information- Significance level, α=0.10 p1 = proportion of women p2 = proportion of men We…
Q: “Snoqualmie” is a name shared by a waterfall and a tribe of Native Americans. In a study of the…
A: The provided data is,
Q: A regional government is interested in expanding the facilities of a day care center for mentally…
A: Given information: It is given that stratified sampling is used with people in the city using the…
Q: It is often useful for retailers to determine why their potential customers chose to visit their…
A: (since not mentioned which question so we shall only answer the first three parts) 1) we shall use…
Q: The color of the Star Trek uniform represents each crew-member's work area. In the original Star…
A: Given data: Alive Dead Total Blue 41 8 49 Gold 22 6 28 Red 31 25 56 Total 94 39 133…
Q: Hurricane damage: In August and September 2005, Hurricanes Katrina and Rita caused extraordinary…
A: Given : x1= 58.0 n1= 370 x2= 30.0 n2= 173 significance level, 0.01
Q: Use these data to construct a 90% confidence interval to estimate the population mean value. Assume…
A:
Q: In a frequency distribution, the coefficient of skewness based on quartiles is 0.5. If the sum of…
A:
Q: The director of student services at San Bernardino Valley College is interested in whether women are…
A: 1)
Q: Do people feel hungrier after sampling a healthy snack? Researchers randomly assign volunteers into…
A: Using SPSS: Type data in to SPSS: To run a One-Way ANOVA in SPSS, click Analyze > Compare Means…
Q: Use the Plan, Solve and Conclude steps in answering this question
A:
Q: A professional marketing survey involves product recognition in New York and California. Of 558 New…
A: We have to test claimm..
Q: Group of answer choices The mean difference between the absorption rate of the reference drug and…
A: Null hypothesis is rejected if the p-value is less than the level of significance. Here, p-value…
Q: The color of the Star Trek uniform represents each crew-member's work area. In the original Star…
A: The question is about categorical data analysis Given : To find : a ) Null and alt. hypo b )…
Q: Refer to Table 2. The mean is O 8 O 5 O 7 O 6
A:
Q: In this assignment, you will calculate the relative risk, attributable risk, and number needed to…
A: Relative risk is calculated by dividing the absolute risk of exposed group and the absolute risk of…
Q: a. Choose the correct null and alternative hypotheses. O Ho: There is an association between Star…
A: AS PER POLICY I HAVE CALCULATED FIRST 3 SUBPARTS PLZ REPOST FOR REMAINING PARTS WITH NOTE I NEED…
Q: Over a nine-month period, OutdoorGearLab tested hardshell jackets designed for ice climbing,…
A: The given data is 4.0, 5.0, 5.0, 5.0, 6.0, 6.0, 7.0, 8.0, 12.0, 12.0
Q: On its municipal website, the city of Tulsa states that the rate it charges per 5 CCF of residential…
A: (a)The null and the alternative hypotheses are given below:
Q: A new over-the-counter medicine to treat a sore throat is to be tested for effectiveness. The makers…
A: The objective of this question is to determine whether there is a significant difference in the mean…
Q: A new over-the-counter medicine to treat a sore throat is to be tested for effectiveness. The makers…
A: The objective of this question is to determine the 95% confidence interval for the difference in…
Q: Over a nine-month period, OutdoorGearLab tested hardshell jackets designed for ice climbing,…
A: The given data is as follows. 5 12 6 8 5 6 7 5 12 4 The formula for the…
Q: Resorts & Spas, a magazine devoted to upscale vacations and accommodations, published its Reader's…
A: The dependent variable is Overall. The independent variables are comfort, amenities and in-house…
Q: (a) Construct a 95% confidence interval estimate of , the population mean procrastination scale for…
A: Confidence interval: Since the population standard deviation is unknown, t distribution can be…
Q: A school psychologist wants to test the effectiveness of a new method of teaching art. She recnuits…
A:
Q: 2. In an experiment to examine the relationship between heart disease and the place of life, the…
A: In an experiment to examine the relationship between heart disease and the place of life, the given…
Q: A researcher conducted a paired samples study to investigate whether local car dealers tend to…
A: Given :
Q: To determine if patrons are satisfied with performance quality, a theater surveys patrons at an…
A: From the provided information, Sample size (n) = 100 70% of these surveys indicated dissatisfaction…
Q: A new over-the-counter medicine to treat a sore throat is to be tested for effectiveness. The makers…
A: The objective of this question is to determine the 95% confidence interval for the difference in…
Q: An experimenter investigated the effects of blue light exposure on people’s sleep quality.…
A: In the given research problem, there are two independent samples- Blue light and No Blue light. The…
Q: A popular blog reports that 45% of college students log in to Instagram on a daily basis. The Dean…
A: Given that:Sample size, Number of students logging in daily (Number of favorable cases), Level of…
Q: An automobile club reported that the average price of regular gasoline in a certain state was $2.62…
A: Data2.662.632.742.552.582.662.712.742.732.562.522.732.612.582.71
Q: A Psychology student wanted to study whether there is a difference in stress levels between gender.…
A: The data set is: Male Female 67 70 68 76 67 69 69 75 70 73 68 88 69 68 70 69 70…
Q: Use the results from a survey of a simple random sample of 1045 adults. Among the 1045…
A: Given that Sample size n =1045 Population proportion p=92%=0.92
Q: After all her students did poorly on their first Science exam, a teacher doubled the amount of…
A: It is needed to determine the appropriate testing procedure for the given scenario.
Q: In the Star and Tribune newspaper, there is an article entitled “1 in 8 school buses fail tests."…
A: Given information: Sample of 200 buses and find that 20 buses fail the safety inspection. Let us…
Q: A special education teacher wants to test the effects of online learning. A class of ten children…
A: The null and alternative hypothesis areH0:μd=0 vs H1:μd<0…
Q: x Resorts & Spas, a magazine devoted to upscale vacations and accommodations, published its…
A: Given: N=20
Q: The director of student services at Oxnard College is interested in whether women are more likely to…
A: Suppose p1, p2 are the population proportions of women and men who attend orientation before they…
Q: a. Construct a 90% confidence interval to estimate the actual proportion of mothers with…
A:
Q: is often useful for retailers to determine why their potential customers chose to visit their store.…
A: a) Population Two b) Formula used c)The null and alternative hypotheses are H0: u1 -u2 = 0 H1:…
Q: vesigate difference in employee satisfaction at non-profit organizations and at for-profit…
A: From the given information, 420 employees 378 of them were highly satisfied. 417 out of 493…
Q: The stated goal of a chain of service stores is to provide a lube and oil change for anyone's…
A: Part AThe longest time it took to service a car was 25.73 minutes. Given that the distribution of…
Q: The average total dollar purchase at a convenience store is less than that at a supermarket. Despite…
A:
Q: Over a nine-month period, OutdoorGearLab tested hardshell jackets designed for ice climbing,…
A: 5, 12, 6, 8, 5, 6, 7, 5, 12, 4 Now first we will arrange the given data in increasing order as 4, 5,…
A hotel claims that 95% of its customers are very satisfied with its service. Complete parts a through d below based on a random sample of five customers.
Step by step
Solved in 2 steps with 2 images
- A randomly sampled group of patients at a major U.S. regional hospital became part of a nutrition study on dietary habits. Part of the study consisted of a 50-question survey asking about types of foods consumed. Each question was scored on a scale from one (most unhealthy behavior) to five (most healthy behavior). The answers were summed and averaged. The population of interest is the patients at the regional hospital. The current survey was implemented after patients were subjected to this education, and it produced the following sample statistics for 25 patients sampled: and s = 1.02. We would like to know if the education improved nutrition behavior. We test the hypotheses H 0: = 2.9 versus Ha: > 2.9. The value of the t test is 1.96, and: a. P-value > 0.1. b. 0.025 P-value < 0.05. c. 0.25 P-value < 0.01. d. 0.05 P-value < 0.1. Given the least squares regression line y = 3 x – 3, which of the following is true? a. The…In the Star and Tribune newspaper, there is an article entitled “1 in 8 school buses fail tests." The article says that the overall statewide proportion of school buses that fail safety tests is 9%. However, one bus company has a higher rate of over 12%. Assume that we want a new estimate for the statewide proportion of school buses that fail the safety inspection. We take a sample of 200 buses and find that 20 buses fail the safety inspection. If we construct a 95% confidence interval estimate for the true proportion of all Minnesota school buses that fail the safety tests, what is the upper limit of the interval? (Enter you answer including 3 decimal positions, e.g. .234)A poll done for Newsweek found that 13% of Americans have seen or sensed the presence of an angel. A contingent doubts that the percent is really that high. It conducts its own survey. Out of 76 Americans surveyed, only two had seen or sensed the presence of an angel. As a result of the contingent's survey, would you agree with the Newsweek poll? Use a 1% level of significance.
- A consumer group wanted to determine if there was a difference in customer perceptions about prices for a specific type of toy depending on where the toy was purchased. In the local area there are three main retailers: W-Mart, Tag, and URToy. For each retailer, the consumer group randomly selected 5 customers, and asked them to rate how expensive they thought the toy was on a 1-to-10 scale (1= not expensive, to 10 = very expensive). The toy was priced the same at all retail stores. Compute the percentage of variance explained by the group differences for these data. Q: Percentage and variance explained = ?Solve the following problems. Show your complete solution.The council leaders of a small town would like to determine the average number of people living in each household. To accomplish this, they send a questionnaire to each residence listed in the town address records, asking the head of the household to record the number of people living in the dwelling. They follow this up with visits to those households that have not responded to the questionnaire until the data collection process is complete. Which of the following is the best description of the method for data collection used by the council leaders? (A) A convenience sample (B) A simple random sample (C) A stratified random sample (D) A cluster random sample (E) A census
- A drug company claims that an allergy medication causes headaches in 5% of those who take it. A medical researcher believes that more than 5% of those who take the drug actually get headaches. Identify the population(s). 5% of those who take the drug actually get headaches. the proportion of those who take the drug who get a headache. all individuals who take the medication. more than 5% of those who take the drug actually get headaches. What is the variable being examined for individuals in the population(s)? more than 5% of those who take the drug actually get headaches. the proportion of those who take the drug who get a headache. whether or not a person who takes the drug gets a headache. 5% of those who take the drug actually get headaches.An automobile club reported that the average price of regular gasoline in a certain state was $2.63 per gallon. The following data show the price per gallon of regular gasoline for 15 randomly selected stations in the state. Complete parts a through c below. 2.66 2.56 2.55 2.66 2.57 2.61 2.63 2.58 2.68 2.64 2.69 2.72 2.75 2.51 2.61 a. Construct a 95% confidence interval to estimate the average price per gallon of gasoline in the state. to $ The 95% confidence interval to estimate the average price per gallon of gasoline in the state is from $ (Round to the nearest cent.)25 of 30 The following graph shows the mean change in mass of two groups of animals fed on different diets over a period of 2 years: Time course of mass change 275 250 225 200 175 150 125 100 0 3 69 12 15 18 21 24 Time (months) Which of these is the most misleading property of this graph? OThe errors vary between data points. O A best fit curve wasn't shown The interpolating lines have different styles. False zero None of these is relevant to this graph. Mass (g) HH H HH HH HH
- Do people feel hungrier after sampling a healthy snack? Researchers randomly assign volunteers into one of three groups. The people in the first group were asked to taste a snack that was billed as a new health bar containing high levels of protein, vitamins, and fiber. The people in the second group were asked to taste the same snack but there told it was a tasty chocolate bar with a raspberry center. After tasting the snack, participants were asked to rate their hunger on a scale from 1 (not at all hungy) to 7 (very hungry). The people in the third group were asked to rate their hunger but were not given a snack. Healthy Tasty No Snack 8 3 3 7 1 3 7 3 5 4 2 6 5 6 5 a. Perform a complete one-way ANOVA hypothesis test. Test at the .05 level of significance.To determine whether caffeine consumption affects the ability to solve math problems, a researcher had one group solve math problems after taking a cup of caffeinated drink and another group solve math problems after taking a cup of water. The group who took the caffeinated drink completed 35 problems in one hour and the group that had water completed 20 problems in one hour. Assuming the number of problems solved is normally distributed in each group, what statistical test would be used to test the research hypothesis? Explain your answer.We want to compare two factories, with respect to the satisfaction shown by customers regarding the service during the period of stay in each factory. For this purpose, customers of similar size were randomly selected. Each customer filled out a questionnaire and the responses generated ratings ranging from 0 to 100, indicating the degree of satisfaction. The results were: Client A B 1 93 60 2 86 58 85 47 90 62 91 58 6. 82 61 7 88 63 8. 86 64 87 68 10 85 58 11 57 12 67 13 61 14 56 15 58 Based on the data presented, test whether the population means are equal. What's your conclusion? Use a = 0.05 Use: Z0,05 = -1,645 Z0,025 = -1,96 t(0,05;23) = -1,714 t(0,025;23) = -2,069