(a) Fit a model with just size of firm as independent variable (Modell). (b) Interpret the coefficients in Modell (c) Fit a regression model with size and type of firm as independent variables (Model2) (d) With a proper plot show the effect of different type of firm on the number of months elapsed (e) Make proper interpretation based on the coefficients in Model2. (f) Run a significant test for the difference of number of months elapsed for different type of firm (mutual, stock) at level 0.05. Also find a 95% CI and interpret it. (g) Based on model 2, estimate the number of months elapsed for a firm with size 200 and type stock. Also find 90% CI and PI for it.


Since you have posted a question with multiple subparts, we will provide solution to the first three sub-parts as per our Q&A guidelines. Please repost the remaining sub parts separately.
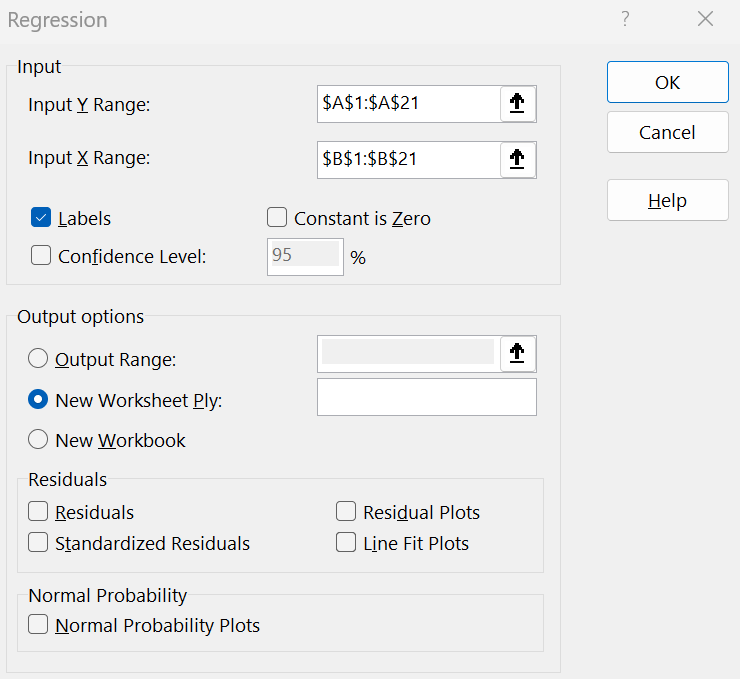
a) After entering the data in Excel go to Data>Data Analysis>Regression>choose the input range for Y and X and tick the "Labels" box>click "OK".
You get the following output:
| SUMMARY OUTPUT | ||||||||
| Regression Statistics | ||||||||
| Multiple R | 0.840777 | |||||||
| R Square | 0.706906 | |||||||
| Adjusted R Square | 0.690623 | |||||||
| Standard Error | 5.231489 | |||||||
| Observations | 20 | |||||||
| ANOVA | ||||||||
| df | SS | MS | F | Significance F | ||||
| Regression | 1 | 1188.167 | 1188.167 | 43.41371 | 3.45E-06 | |||
| Residual | 18 | 492.6326 | 27.36848 | |||||
| Total | 19 | 1680.8 | ||||||
| Coefficients | Standard Error | t Stat | P-value | Lower 95% | Upper 95% | Lower 95.0% | Upper 95.0% | |
| Intercept | 36.4821 | 2.844252 | 12.82661 | 1.71E-10 | 30.50656 | 42.45767 | 30.50656 | 42.45767 |
| x | -0.0939 | 0.014257 | -6.58891 | 3.45E-06 | -0.12389 | -0.06398 | -0.12389 | -0.06398 |
The equation of model 1 is:
format('truetype')%3Bfont-weight%3Anormal%3Bfont-style%3Anormal%3B%7D%3C%2Fstyle%3E%3C%2Fdefs%3E%3Cline%20stroke%3D%22%23000000%22%20stroke-linecap%3D%22square%22%20stroke-width%3D%221%22%20x1%3D%220.5%22%20x2%3D%224.5%22%20y1%3D%226.5%22%20y2%3D%223.5%22%2F%3E%3Cline%20stroke%3D%22%23000000%22%20stroke-linecap%3D%22square%22%20stroke-width%3D%221%22%20x1%3D%224.5%22%20x2%3D%228.5%22%20y1%3D%223.5%22%20y2%3D%226.5%22%2F%3E%3Ctext%20font-family%3D%22Arial%22%20font-size%3D%2216%22%20font-weight%3D%22bold%22%20text-anchor%3D%22middle%22%20x%3D%224.5%22%20y%3D%2217%22%3Ey%3C%2Ftext%3E%3Ctext%20font-family%3D%22math19df71cc037e14b064558084cb4%22%20font-size%3D%2216%22%20font-weight%3D%22bold%22%20text-anchor%3D%22middle%22%20x%3D%2218.5%22%20y%3D%2217%22%3E%3D%3C%2Ftext%3E%3Ctext%20font-family%3D%22Arial%22%20font-size%3D%2216%22%20font-weight%3D%22bold%22%20text-anchor%3D%22middle%22%20x%3D%2237.5%22%20y%3D%2217%22%3E36%3C%2Ftext%3E%3Ctext%20font-family%3D%22math19df71cc037e14b064558084cb4%22%20font-size%3D%2216%22%20font-weight%3D%22bold%22%20text-anchor%3D%22middle%22%20x%3D%2250.5%22%20y%3D%2217%22%3E.%3C%2Ftext%3E%3Ctext%20font-family%3D%22Arial%22%20font-size%3D%2216%22%20font-weight%3D%22bold%22%20text-anchor%3D%22middle%22%20x%3D%2272.5%22%20y%3D%2217%22%3E4821%3C%2Ftext%3E%3Ctext%20font-family%3D%22math19df71cc037e14b064558084cb4%22%20font-size%3D%2216%22%20font-weight%3D%22bold%22%20text-anchor%3D%22middle%22%20x%3D%22102.5%22%20y%3D%2217%22%3E%26%23x2212%3B%3C%2Ftext%3E%3Ctext%20font-family%3D%22Arial%22%20font-size%3D%2216%22%20font-weight%3D%22bold%22%20text-anchor%3D%22middle%22%20x%3D%22116.5%22%20y%3D%2217%22%3E0%3C%2Ftext%3E%3Ctext%20font-family%3D%22math19df71cc037e14b064558084cb4%22%20font-size%3D%2216%22%20font-weight%3D%22bold%22%20text-anchor%3D%22middle%22%20x%3D%22124.5%22%20y%3D%2217%22%3E.%3C%2Ftext%3E%3Ctext%20font-family%3D%22Arial%22%20font-size%3D%2216%22%20font-weight%3D%22bold%22%20text-anchor%3D%22middle%22%20x%3D%22146.5%22%20y%3D%2217%22%3E0939%3C%2Ftext%3E%3Ctext%20font-family%3D%22Arial%22%20font-size%3D%2216%22%20font-style%3D%22italic%22%20font-weight%3D%22bold%22%20text-anchor%3D%22middle%22%20x%3D%22171.5%22%20y%3D%2217%22%3Ex%3C%2Ftext%3E%3C%2Fsvg%3E) , where
, where  is the predicted number of months elapsed and x is the size of the firm (in millions).
b) In model 1, intercept = 36.4821 which is the average number of months elapsed for a firm with size of 0 million.
The slope coefficient is -0.0939. It means that for every extra million in size of the firm, the number of months elapsed decreases by 0.0939, on average.

Step by step
Solved in 3 steps with 5 images


