A factorial experiment involving two levels of factor A and three levels of factor B resulted in the following data. Factor A Level 1 Level 2 Level 1 131 161 129 99 Factor B Level 2 94 70 123 101 Level 3 75 93 120 136 Test for any significant main effects and any interaction. Use α = 0.05. Find the value of the test statistic for factor A. (Round your answer to two decimal places.) Find the p-value for factor A. (Round your answer to three decimal places.) p-value = State your conclusion about factor A. O Because the p-value > a = 0.05, factor A is significant. O Because the p-value > a = 0.05, factor A is not significant. O Because the p-value ≤ α = 0.05, factor A is not significant. O Because the p-value ≤ α = 0.05, factor A is significant. Find the value of the test statistic for factor B. (Round your answer to two decimal places.) Find the p-value for factor B. (Round your answer to three decimal places.) p-value =
A factorial experiment involving two levels of factor A and three levels of factor B resulted in the following data. Factor A Level 1 Level 2 Level 1 131 161 129 99 Factor B Level 2 94 70 123 101 Level 3 75 93 120 136 Test for any significant main effects and any interaction. Use α = 0.05. Find the value of the test statistic for factor A. (Round your answer to two decimal places.) Find the p-value for factor A. (Round your answer to three decimal places.) p-value = State your conclusion about factor A. O Because the p-value > a = 0.05, factor A is significant. O Because the p-value > a = 0.05, factor A is not significant. O Because the p-value ≤ α = 0.05, factor A is not significant. O Because the p-value ≤ α = 0.05, factor A is significant. Find the value of the test statistic for factor B. (Round your answer to two decimal places.) Find the p-value for factor B. (Round your answer to three decimal places.) p-value =

MATLAB: An Introduction with Applications
6th Edition
ISBN:9781119256830
Author:Amos Gilat
Publisher:Amos Gilat
Chapter1: Starting With Matlab
Section: Chapter Questions
Problem 1P

Related questions
Question
The interaction questions please (The last 3)
![**Factorial Experiment Analysis**
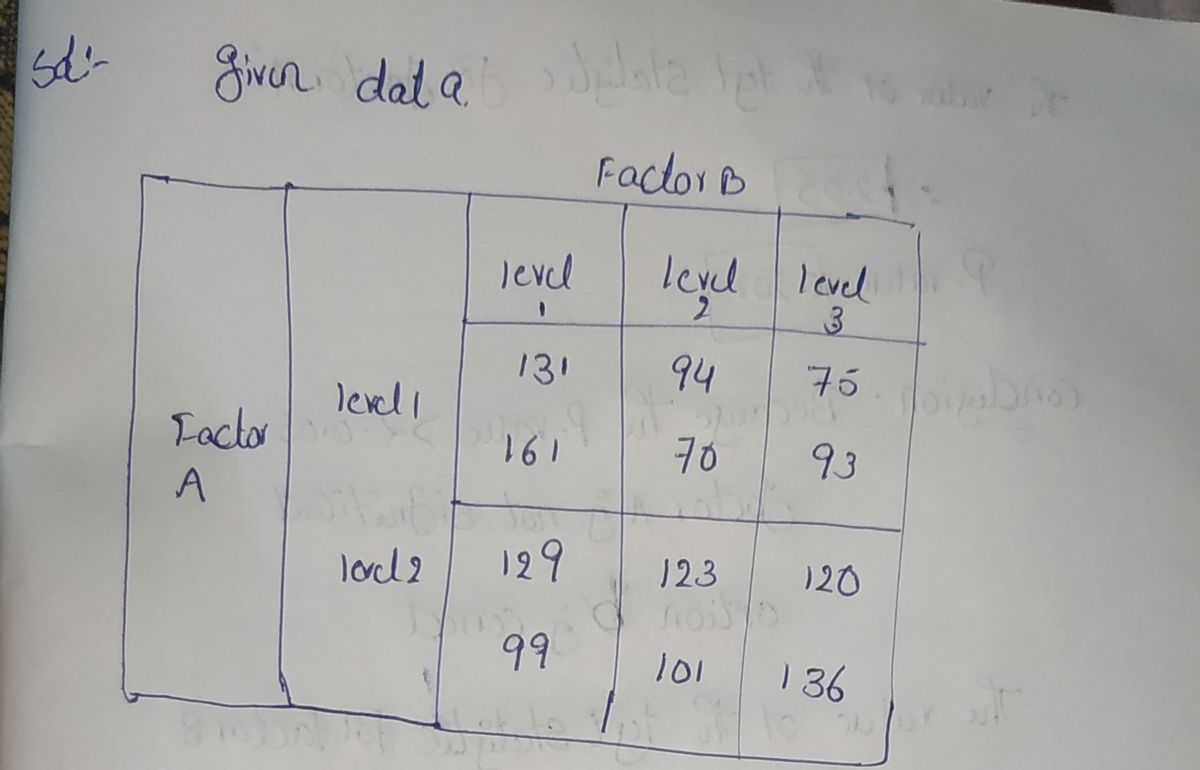
A factorial experiment involving two levels of Factor A and three levels of Factor B resulted in the following data:
| | Factor B |
|-------------|-----------------|
| | Level 1 | Level 2 | Level 3 |
| **Factor A** | | | |
| Level 1 | 131 | 94 | 75 |
| | 161 | 70 | 93 |
| Level 2 | 129 | 123 | 120 |
| | 99 | 101 | 136 |
**Instructions:**
Conduct a test for any significant main effects and any interaction, using α = 0.05.
1. **Calculate the Test Statistic for Factor A:**
- Round your answer to two decimal places and enter it in the space provided.
- [Input box]
2. **Calculate the p-value for Factor A:**
- Round your answer to three decimal places and enter it in the space provided.
- \( p\text{-value} = \) [Input box]
3. **State Your Conclusion About Factor A:**
Choose the correct conclusion based on the calculated p-value:
- ☐ Because the \( p\text{-value} > \alpha = 0.05 \), Factor A is significant.
- ☐ Because the \( p\text{-value} > \alpha = 0.05 \), Factor A is not significant.
- ☐ Because the \( p\text{-value} \leq \alpha = 0.05 \), Factor A is not significant.
- ☐ Because the \( p\text{-value} \leq \alpha = 0.05 \), Factor A is significant.
4. **Calculate the Test Statistic for Factor B:**
- Round your answer to two decimal places and enter it in the space provided.
- [Input box]
5. **Calculate the p-value for Factor B:**
- Round your answer to three decimal places and enter it in the space provided.
- \( p\text{-value} = \) [Input box]
**Graph/Diagram Explanation:**
The table above represents the mean values obtained from a factorial experiment with two factors, A and B, each with different levels. Factor A has two levels, and Factor B has](/v2/_next/image?url=https%3A%2F%2Fcontent.bartleby.com%2Fqna-images%2Fquestion%2F8ad87420-52d2-4e34-815e-eb9bcb5c95c0%2F095908fa-1010-4f0e-b853-939580284db7%2Fxvhf27g_processed.png&w=3840&q=75)
Transcribed Image Text:**Factorial Experiment Analysis**
A factorial experiment involving two levels of Factor A and three levels of Factor B resulted in the following data:
| | Factor B |
|-------------|-----------------|
| | Level 1 | Level 2 | Level 3 |
| **Factor A** | | | |
| Level 1 | 131 | 94 | 75 |
| | 161 | 70 | 93 |
| Level 2 | 129 | 123 | 120 |
| | 99 | 101 | 136 |
**Instructions:**
Conduct a test for any significant main effects and any interaction, using α = 0.05.
1. **Calculate the Test Statistic for Factor A:**
- Round your answer to two decimal places and enter it in the space provided.
- [Input box]
2. **Calculate the p-value for Factor A:**
- Round your answer to three decimal places and enter it in the space provided.
- \( p\text{-value} = \) [Input box]
3. **State Your Conclusion About Factor A:**
Choose the correct conclusion based on the calculated p-value:
- ☐ Because the \( p\text{-value} > \alpha = 0.05 \), Factor A is significant.
- ☐ Because the \( p\text{-value} > \alpha = 0.05 \), Factor A is not significant.
- ☐ Because the \( p\text{-value} \leq \alpha = 0.05 \), Factor A is not significant.
- ☐ Because the \( p\text{-value} \leq \alpha = 0.05 \), Factor A is significant.
4. **Calculate the Test Statistic for Factor B:**
- Round your answer to two decimal places and enter it in the space provided.
- [Input box]
5. **Calculate the p-value for Factor B:**
- Round your answer to three decimal places and enter it in the space provided.
- \( p\text{-value} = \) [Input box]
**Graph/Diagram Explanation:**
The table above represents the mean values obtained from a factorial experiment with two factors, A and B, each with different levels. Factor A has two levels, and Factor B has
![### Analysis of Variance (ANOVA) for Factors
#### Factor B Analysis
1. **Find the value of the test statistic for factor B.**
- Instruction: Round your answer to two decimal places.
2. **Find the \( p \)-value for factor B.**
- Instruction: Round your answer to three decimal places.
- \( p \)-value = [Input Field]
3. **State your conclusion about factor B.**
- Options:
- ○ Because the \( p \)-value \( \leq \alpha = 0.05\), factor B is not significant.
- ○ Because the \( p \)-value \( > \alpha = 0.05\), factor B is not significant.
- ○ Because the \( p \)-value \( > \alpha = 0.05\), factor B is significant.
- ○ Because the \( p \)-value \( \leq \alpha = 0.05\), factor B is significant.
#### Interaction Between Factors A and B
4. **Find the value of the test statistic for the interaction between factors A and B.**
- Instruction: Round your answer to two decimal places.
5. **Find the \( p \)-value for the interaction between factors A and B.**
- Instruction: Round your answer to three decimal places.
- \( p \)-value = [Input Field]
6. **State your conclusion about the interaction between factors A and B.**
- Options:
- ○ Because the \( p \)-value \( \leq \alpha = 0.05\), the interaction between factors A and B is significant.
- ○ Because the \( p \)-value \( > \alpha = 0.05\), the interaction between factors A and B is not significant.
- ○ Because the \( p \)-value \( > \alpha = 0.05\), the interaction between factors A and B is significant.
- ○ Because the \( p \)-value \( \leq \alpha = 0.05\), the interaction between factors A and B is not significant.](/v2/_next/image?url=https%3A%2F%2Fcontent.bartleby.com%2Fqna-images%2Fquestion%2F8ad87420-52d2-4e34-815e-eb9bcb5c95c0%2F095908fa-1010-4f0e-b853-939580284db7%2Fy9nv33i_processed.png&w=3840&q=75)
Transcribed Image Text:### Analysis of Variance (ANOVA) for Factors
#### Factor B Analysis
1. **Find the value of the test statistic for factor B.**
- Instruction: Round your answer to two decimal places.
2. **Find the \( p \)-value for factor B.**
- Instruction: Round your answer to three decimal places.
- \( p \)-value = [Input Field]
3. **State your conclusion about factor B.**
- Options:
- ○ Because the \( p \)-value \( \leq \alpha = 0.05\), factor B is not significant.
- ○ Because the \( p \)-value \( > \alpha = 0.05\), factor B is not significant.
- ○ Because the \( p \)-value \( > \alpha = 0.05\), factor B is significant.
- ○ Because the \( p \)-value \( \leq \alpha = 0.05\), factor B is significant.
#### Interaction Between Factors A and B
4. **Find the value of the test statistic for the interaction between factors A and B.**
- Instruction: Round your answer to two decimal places.
5. **Find the \( p \)-value for the interaction between factors A and B.**
- Instruction: Round your answer to three decimal places.
- \( p \)-value = [Input Field]
6. **State your conclusion about the interaction between factors A and B.**
- Options:
- ○ Because the \( p \)-value \( \leq \alpha = 0.05\), the interaction between factors A and B is significant.
- ○ Because the \( p \)-value \( > \alpha = 0.05\), the interaction between factors A and B is not significant.
- ○ Because the \( p \)-value \( > \alpha = 0.05\), the interaction between factors A and B is significant.
- ○ Because the \( p \)-value \( \leq \alpha = 0.05\), the interaction between factors A and B is not significant.
Expert Solution
Step 1

Step by step
Solved in 5 steps with 5 images

Recommended textbooks for you
MATLAB: An Introduction with Applications
Statistics
ISBN:
9781119256830
Author:
Amos Gilat
Publisher:
John Wiley & Sons Inc

Probability and Statistics for Engineering and th…
Statistics
ISBN:
9781305251809
Author:
Jay L. Devore
Publisher:
Cengage Learning

Statistics for The Behavioral Sciences (MindTap C…
Statistics
ISBN:
9781305504912
Author:
Frederick J Gravetter, Larry B. Wallnau
Publisher:
Cengage Learning
MATLAB: An Introduction with Applications
Statistics
ISBN:
9781119256830
Author:
Amos Gilat
Publisher:
John Wiley & Sons Inc
Probability and Statistics for Engineering and th…
Statistics
ISBN:
9781305251809
Author:
Jay L. Devore
Publisher:
Cengage Learning
Statistics for The Behavioral Sciences (MindTap C…
Statistics
ISBN:
9781305504912
Author:
Frederick J Gravetter, Larry B. Wallnau
Publisher:
Cengage Learning

Elementary Statistics: Picturing the World (7th E…
Statistics
ISBN:
9780134683416
Author:
Ron Larson, Betsy Farber
Publisher:
PEARSON

The Basic Practice of Statistics
Statistics
ISBN:
9781319042578
Author:
David S. Moore, William I. Notz, Michael A. Fligner
Publisher:
W. H. Freeman

Introduction to the Practice of Statistics
Statistics
ISBN:
9781319013387
Author:
David S. Moore, George P. McCabe, Bruce A. Craig
Publisher:
W. H. Freeman