A curious bartender records the number of beverages ordered by each of her 15 customers during the course of a four-hour shift. Use the data to create an ungrouped frequency table (you may use the back of this page) and answer the questions below. 1 3 5 13 6 4 3 2 5 7 1 2 3 5 5 1. Describe the distribution in terms of its shape, symmetry, and peakedness. 2. For what does X stand? 3. For what does f stand?


Inverse Normal Distribution
The method used for finding the corresponding z-critical value in a normal distribution using the known probability is said to be an inverse normal distribution. The inverse normal distribution is a continuous probability distribution with a family of two parameters.
Mean, Median, Mode
It is a descriptive summary of a data set. It can be defined by using some of the measures. The central tendencies do not provide information regarding individual data from the dataset. However, they give a summary of the data set. The central tendency or measure of central tendency is a central or typical value for a probability distribution.
Z-Scores
A z-score is a unit of measurement used in statistics to describe the position of a raw score in terms of its distance from the mean, measured with reference to standard deviation from the mean. Z-scores are useful in statistics because they allow comparison between two scores that belong to different normal distributions.
Ungrouped Frequency
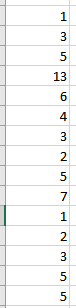
A curious bartender records the number of beverages ordered by each of her 15 customers during the course of a four-hour shift. Use the data to create an ungrouped frequency table (you may use the back of this page) and answer the questions below.
1 3 5 13 6 4 3 2 5 7 1 2 3 5 5
1. Describe the distribution in terms of its shape, symmetry, and peakedness.
2. For what does X stand?
3. For what does f stand?
4. According to your text, should the lowest or highest score be at the
bottom of a frequency distribution table? Why or why not do you think this appropriate?
Hello. Since you have posted a question with multiple sub-parts, we will solve first three sub parts for you. To get remaining sub-part solved please repost the complete question and mention the sub-parts to be solved.
1.
Enter this data into Excel
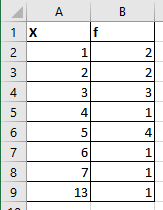
Create a frequency distribution for the given data
Now making a scatter plot of this data
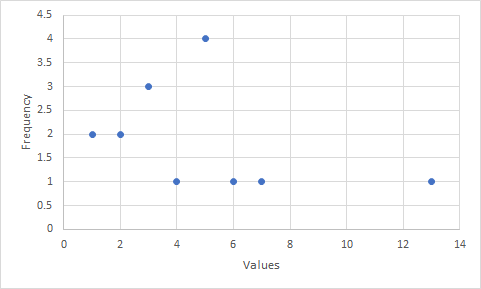
This shows that
- Data is positively skewed
- Symmetry is not present in the data
- Data has only one peak therefore unimodal

Trending now
This is a popular solution!

Step by step
Solved in 3 steps with 3 images


