(a) Construct a stem-and-leaf display using the thousands digit as the stem and the hundreds digit as the leaf. (Enter numbers from smallest to largest separated by spaces. Enter NONE for stems with no values.) Stems Leaves 123334555599 001222346 89 1112344479 3 011333 8 36 5 23777 Comment on the various features of the display. (Select all that apply.) O The display is symmetric. O The display has a negative skew. O A typical data value is somewhere in the low 2000's. O A typical data value is somewhere in the high 3000's. V The display has a positive skew.
Hello, I got some wrong and need help in understanding this homework question.
![(b) Construct a histogram using class boundaries 0, 1000, 2000, 3000, 4000, 5000, and 6000.
Frequency
Frequency
10|
12
10
8
8
4
4
2
2
Total
Total
1000 2000 3000 4000 5000 6000length
Frequency
Frequency
12
6
10
5
8
4
3
4
2
2
1
Total
Total
1000 2000 3000 4000 5000 6000length
What proportion of subdivisions have total length less than 2000? Between 2000 and 4000? (Round your answers to three decimal places.)
less than 2000
0.489
between 2000 and 4000
0.362
How would you describe the shape of the histogram? (Select all that apply.)
The display has a positive skew.
The display is symmetric.
The display has a negative skew.
A typical data value is somewhere in the high 3000's.
A typical data value is somewhere in the low 2000's.](/v2/_next/image?url=https%3A%2F%2Fcontent.bartleby.com%2Fqna-images%2Fquestion%2F86bfc21f-7304-4d6a-8ae3-de059a5180e7%2F73bcf0a3-320f-4856-a72f-de52d84d2d13%2Fpc1ycak_processed.png&w=3840&q=75)
![An article gave data on various characteristics of subdivisions that could be used in deciding whether to provide electrical power using overhead lines or underground lines. Here are the values of the variable x = total length of streets
within a subdivision:
1280 5320 4390 2100 1240 3060 4670
1050
360 3330 3380
340 1000
960
1320
530 3350
540 3870 1250 2400
960 1120 2120
450 2250 2320 2400
3150 5700 5220
500 1850 2460 5750
2800 2730 1670
100 5770 3150 1990
510
240
396 1419 2109
(a) Construct a stem-and-leaf display using the thousands digit as the stem and the hundreds digit as the leaf. (Enter numbers from smallest to largest separated by spaces. Enter NONE for stems with no values.)
Stems
Leaves
1233345 55599
0012223 4 6 8 9
2
1112344479
011333 8
4
36
23777
Comment on the various features of the display. (Select all that apply.)
The display is symmetric.
The display has a negative skew.
O A typical data value is somewhere in the low 2000's.
A typical data value is somewhere in the high 3000's.
The display has a positive skew.](/v2/_next/image?url=https%3A%2F%2Fcontent.bartleby.com%2Fqna-images%2Fquestion%2F86bfc21f-7304-4d6a-8ae3-de059a5180e7%2F73bcf0a3-320f-4856-a72f-de52d84d2d13%2Feznh8nq_processed.png&w=3840&q=75)
![](/static/compass_v2/shared-icons/check-mark.png)
let us construct class frequency table
class | frequency |
0-1000 | 12 |
1000-2000 | 11 |
2000-3000 | 10 |
3000-4000 | 7 |
4000-5000 | 2 |
5000-6000 | 5 |
from the table we get a histogram like this
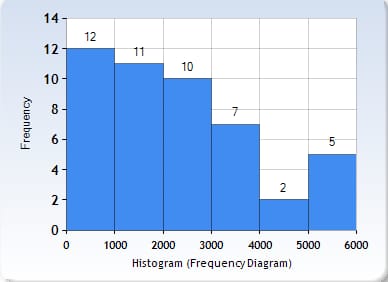
this histogram matches with the 4th option
proportion of subdivision total length
less than 2000
Since there are 12 + 11 =23 values out of 47 values which are below 2000. hence the required proportion would be
= 23/47 = 0.489
less than 2000 = 0.489
between 2000 and 4000
between 2000 and 4000 there are 17 values . Hence the proportion will be
= 17/47 = 0.362
between 2000 and 4000 = 0.362
Describe the shape of histogram
Based on the histogram the correct statements would be,
The display has a positive skew.
A typical data value is somewhere in the low 2000's.
Trending now
This is a popular solution!
Step by step
Solved in 2 steps with 1 images
![Blurred answer](/static/compass_v2/solution-images/blurred-answer.jpg)
![MATLAB: An Introduction with Applications](https://www.bartleby.com/isbn_cover_images/9781119256830/9781119256830_smallCoverImage.gif)
![Probability and Statistics for Engineering and th…](https://www.bartleby.com/isbn_cover_images/9781305251809/9781305251809_smallCoverImage.gif)
![Statistics for The Behavioral Sciences (MindTap C…](https://www.bartleby.com/isbn_cover_images/9781305504912/9781305504912_smallCoverImage.gif)
![Elementary Statistics: Picturing the World (7th E…](https://www.bartleby.com/isbn_cover_images/9780134683416/9780134683416_smallCoverImage.gif)
![The Basic Practice of Statistics](https://www.bartleby.com/isbn_cover_images/9781319042578/9781319042578_smallCoverImage.gif)
![Introduction to the Practice of Statistics](https://www.bartleby.com/isbn_cover_images/9781319013387/9781319013387_smallCoverImage.gif)