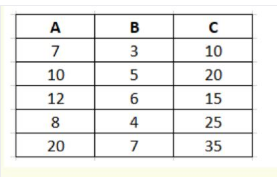
A 7 10 10 5 20 12 6. 15 8 4 25 20 7 35
Q: A. Determine the test statistic B. Determine the critical value for chi square. C. Reject H0 or…
A: We want find test statistics, critical value and decision
Q: Let 7 denote the proportion of grocery store cus- tomers that use the store's club card. For a large…
A:
Q: 7. Assume that you want to use a 0.05 significance level to test the claim that the paired sample…
A: The claim is that the paired sample data come from a population for which the mean difference is…
Q: In a tasting session, a random sample of 100 subjects from a consumer population tasted a certain…
A: Given information: n=100μ=6.0 One-sided p value of the test is 0.0068.
Q: A. Determine the coefficient of determination and alienation – interpret B. Is r statistically…
A: The question is about correlation.Given :To find :A ) Coefficient of determination and alienation.…
Q: The accompanying data table contains chest deceleration measurements (in g, where g is the force of…
A: Given that, The accompanying data table contains chest deceleration measurements(in g, where g…
Q: At the 0.01 significance level, can we conclude that there is a difference in the mean percent of…
A: The test to be carried out is- H0:μs=μe vs H1:μs≠μe The following measures are found for the given…
Q: a. Use the sample data with a 0.05 significance level to test the claim that for the population of…
A: Actress (years) Actor (years) 28 57 27 34 30 38 28 39 32 29 23 35 27 47 43 38 29…
Q: d. Find the UCL for the x-chart. e. Find the LCL for the x-chart. f. Is this process in control?…
A:
Q: We would like to investigate whether there is a relationship between weather conditions and the inci…
A: k= 4 Cateegories n=1361 Sample size
Q: The BMI levels for a random sample of thirty females with a college degree and for a random sample…
A: Solution: 5. Let µ1 be the average BMI level for females with a college degree and µ2 be the average…
Q: Recall from Exercise 2 the data on the concen- tration (EU/mg) in settled dust for one sample of…
A: Given data on the concen- tration (EU/mg) in settled dust for one sample of urban homes and another…
Q: If a research design has one nominal independent variable with two between-groups levels and a scale…
A: The statistical test is used to determine whether the sample is taken from the population or not.…
Q: 2. Aconstruction company operates four machines in threeshifts each day. From the production…
A: Using the provided information, the null and alternative hypotheses are H0: Breaks are independent…
Q: b) The table below shows the color and the model of cars purchased by 160 randomly selected…
A: The objective is to find out the p-value based on the chi-square test of the following data:…
Q: 11.2,1 The table below summarizes data from a survey of a sample of women. Using a 0.05…
A: Given: Man Woman Women who agree 458 345 Women who disagree 242 55
Q: 2. Two hundred men selected at random from various levels of management were interviewed regarding…
A: The question is about categorical data analysis.Given :To find :Is there a relationship between…
Q: 10) Using the data below and a 0.05 significance level, test the claim that the responses occur with…
A: Formula : Test statistic is
Q: 1. A researcher was interested in defining the relationship between type of television program and…
A: Given the data as Program type Amount of time watching TV N=20 G=60 ∑x2=256 Little watching…
Q: Refer to the research analysis output below. Which statement is TRUE? Group of answer choices a. A…
A: p-value = 0.001 T = -3.48
Q: Q) Consider the following ungrouped data: 41 46 7 46 32 5 14 28 48 49…
A: g) Mean deviation is, a) Mean deviation about mean is, Mean =Σxn =65120 =32.55Mean…
Q: (a) In performing this statistical test, state the hypotheses. O Họ: the total number of apples…
A: Since you have posted a question with multiple sub-parts, we will solve first three subparts for…
Q: Use the sample data with a 0.01 significance level to test the claim that for the population of ages…
A: Let ud is the mean value of the differences d for the population of all pairs of data, where each…
Q: The table shows the lifetimes in hours of samples from three different types of plant species…
A: Sample 1 Sample 2 Sample 3 457 454 460 461 456 458 459 458 456 455 458 452
Q: False alarm: The numbers of false fire alarms were counted each month at a number of sites. The…
A: Hey, since there are multiple questions posted, we will answer first question. If you want any…
Q: .005 and .01
A: The 18 red room subjects had an average solve time of 10.13 seconds with a standard deviation of…
Q: The manager of a computer software company wishes to study the number of hours per week senior…
A: (1)The hypotheses for the given problem is given below:
Q: The following information is available for two samples selected from independent normally…
A: Given: Population A Variance, s12=36 Sample Size, n1=30 Population B Variance, s22=25 Sample Size,…
Q: The heart rates before and after running a race (in beats per minute) of a sample of four athletes…
A: 1.4) Null hypothesis: μAfter-Before=70 Alternate hypothesis: μAfter-Before>70 This is one tailed…
Q: The better-selling candies are often high in calories. Assume that the following data show the…
A: Given Information: The data represents the calorie content from samples of M&M's, kit Kat and…
Q: 1. Two samples drawn from normal distributions with the following sample sizes: ni = 15 and na= 15.…
A: We have given that n1 = 15 = n2 x̅1 = 6.2, x̅2 = 7.8 s12 = 4, s22 = 6.25
Q: Formulate research problems and hypotheses to test the effect between 2 variables (variable X and…
A: Use the Excel And Perform the Regression. Followings are the Steps to perform the Regression 1) Open…
Q: a) b) c) Approximately how many scores are equal to or greater than 74? What score corresponds to…
A: As per guidelines i have calculated 3 subparts of first main question , kindly repost for Remaining…
Q: 9) Five drivers were selected to test drive two makes of automobiles. The following table shows the…
A: here we have conducted the hypothesis under a level of significance α is 0.05 n1=5n2=5degrees of…
Q: here are the 25 data set 4;4;5;5;5;6;6;6;6;7;7;7;7;8;8;8;9;9;9;10;10;10;11; 12;12 mean : 7.64 sd:…
A: Note that : The Empirical Rule does not apply to all data sets, only to those that are bell-shaped,…
Q: b) The table below shows the color and the model of cars purchased by 160 randomly selected…
A:
Q: 2. An experiment was conducted to determine whether four firing temperatures affect the density of…
A: Given data: Temperature No. of Bricks (Reps) Total Density Mean Density 100 3 65.4 21.80…
Q: Data was collected for a sample of organic snacks. The ar summarized in the histogram below. 12 10
A: Frequency of a class gives the number of observations lies in that class. The frequency distribution…
Q: The amount of waste that the three machines gave during the production phase was observed and is…
A: Excel Procedure: Enter the data for X, Y and Z in Excel sheet>Data>Data Analysis>Select…
Q: The following sample data reflect shipments received by a large firm from three different vendors…
A: Solution
27
The production numbers for five days in a factory producing three different products are given in the Table. Production numbers do not satisfy parametric assumptions. When investigating whether there is a difference between the production numbers of different products at the 0.05 significance level, which of the following is the test statistic?
7 - |
|
|
Given data :
Step by step
Solved in 4 steps with 2 images
- 1.Determine the test statistic 2. Determine the P-Value47Listed below are numbers of intemet users per 100 people and numbers of scientific award winners per 10 million people for different countries. Construct a scatterplot, find the value of the line comtation coefficient and Kfind the value of r. Determine whether there is sufficient evidence to suppon a claim of linear comelation between the two variables. Use a significance level of a -0.01. Internet Users Award Winners 80.7 79.7 57.1 67.3 772 5.3 9.1 32 16 10.8 Construct a scatterplot Choose the correct graph below. OA LU odo a The linear correlation coefficient isr (Round to three decimal places as needed.) Determine the null and alternative hypotheses HO P HOP (Type integers or decimals. Do not round) The test statistic is t (Round to two decimal places as needed) The value is (Round to three deomal places as needed.) OB. Because the Palun of the linear correlation coefficient is award winners 37.8 0.1 Q OC M ddu 00. db the significance level, thereficent evidence to support the…
- Formulate research problems and hypotheses to test the effect between 2 variables (variable X and variable Y). The following presents quantitative data from the measurement results of variables X and Y from a number of individuals (sample) taken randomly from a certain population. The distribution of the measurement data is as follows: No. Resp. 1 2 3 456 789 10 11 12 13 14 15 16 Var.X 11 22 9 5 25 10 13 12 17 16 20 15 18 19 23 28 Var.Y 17 30 12 9 34 15 20 19 24 22 29 21 25 27 31 36 Based on these data, solve the following statistical problems: d. What is the direction of the relationship formed between the X variable and the Y variable?A17. Weight losses of 12 persons in an experimental one-week diet program are given below: 3.0 5.3 0.2 Weight Loss in Pounds 0.2 3.7 3.7 -1.2 5.9 2.0 1.4 1.7 3.6 Do these results indicate that a mean weight loss was achieved? ( m, > 0) (Perform a hypothesis testing with a = 0.05).
- 3. A researcher samples 5 colony of Species of K and 5 colonies of Species L, measures their sizes as: Species K Species L 4.7 5.3 5.2 4.6 6.1 4.1 5.8 4.8 5.2 4.2 а. Test if mean colony size of Species K and Species L are different from each other? Report a p-value. (You mav need to do an additional test to decide which test to apply for comparing the means) b. What is the power of the test in part a? С. The researcher would like to design a new experiment which will allow a two tailed hypothesis test with significance 0.05 and power 0.90. What should be the sample sizes nk and ni for Species K and Species L (use k = 1). %3D2) Researchers are interested in whether there is any relationship between a person's IQ (x- variable) and how long they live (y-variable). Answer the questions below by using the data provided. Show your work and use the back of the page if necessary. X Y 10 3 6. 6. 7 4 3 4 a) What type of statistical analysis would be most appropriate to use in this scenario? Please justify your answer. b) Please state the null and alternative hypotheses. c) Please report the results of your statistical analyses and make a decision about whether to reject or fail to reject the null hypothesis Use alpha = .05 (two-tailed). %3DThe Gulf Company believes that the cost of a customer's shipment is determined by the weight of the packages being shipped. To investigate whether this relationship is justifiable, a random sample of 10 customer shipments was selected and the weight in kilograms (kg) and the cost in Omani Rial were recorded. Weight (kg) Cost (OMR) Y 6. 8. 9. 7 11 9. 11 17 27 13 16 8 6. 18 25 17 21 20 24 a. Perform a regression analysis to estimate the values of Bo and B, of the regression equation Y=Bo + B,X.(7 marks) b. Interpret the values you obtained fer Bo and B1 (6 marks) €. Estimate the cost of a shipment whose weight is 19 kg. (1 mark)
- Listed below are the number of cricket chirps in 1 min and the corresponding temperatures in degrees Fahrenheit. Is there sufficient evidence to conclude that there is a relationship between the number of cricket chirps in 1 min and the temperature? Use a significance level of α=0.05. Chirps in 1 min 1171 1105 1185 852 1089 950 917 862 Temperature (°F) 78.4 88.2 91.5 86.3 90.2 79.3 83.8 84.4 Determine the null and alternative hypotheses for this test. Find the value of the correlation coefficient. rs=enter your response here (Round to three decimal places as needed.) Determine the critical value(s) of the correlation coefficient. enter your response here (Round to three decimal places as needed. Use a comma to separate answers as needed.)Here is sample data on screen time (in minutes/hr) for 3 different populations. Children 19 19 17 18 21 23 15 13 13 17 18 21 25 24 17 Teens 21 17 26 34 43 39 32 27 21 10 45 Adults 33 34 33 23 56 21 34 21 17 40 Test the claim mean screen time is the same for all populations. Use α = 0.10. Does one population appear to have more screen time than other populations? Explain in 1 - m2 complete sentences.Q.3 For the following data: a) Compute SST, SSTR, SSE b) Construct a one-way ANOVA table c) Decide at the 5% significance level, whether the data provide sufficient evidence to conclude that the means of the populations from which the samples are drawn are not the same. Sample 1 Sample 2 Sample 3 Sample 4 11 16 6 2 10 7 4 10 3. we have: ng = 3 n3= 3 n4 = 3 Ta 24 = 1s Ty= 36 THa9 n z Enj = 12 Exz= IT;= &4 ..... Ex - (Ex:*/n = SSTR = I (Tim;) - (Iri)/n = ()+( )+( )+( ) -- 2. SST = 12 SSE = 5sT - SSTR = Fostatistic df MS 2 df :عاطء Souree SS MSTR/MSE 138 Treatment where: MSE- SSE/(n-k) MSTR = SSTR/(K-1) Enron Tofal df z ( 3, 8) caitical Valme s ? Compare test- statistic to cv. Do you rejuctNull or Do not rejrit what dees it mean ? write here